Single-family prices climbed as condo new listings doubled across Sandy Springs in August 2026
Single-family homes in Sandy Springs sold in a median of just 13 days in August 2026, down from 33 days a year earlier (FMLS, August 2026). That pace sets the tone for the Sandy Springs real estate market August 2026 update, a month when single-family pricing firmed while condo supply grew and prices softened.
This Sandy Springs real estate market update covers single-family and condo activity in this Fulton County city, using data from First Multiple Listing Service (FMLS). It walks through the key numbers, inventory by price band, and what the figures mean for buyers and sellers. For the prior month, see the Sandy Springs July 2026 market report.
Sandy Springs Real Estate Market August 2026: What Do the Key Numbers Show?
The key numbers show two segments moving in different directions. Single-family homes posted a median sold price of $956,500, up 6.99 percent from August 2025, with a median of 13 days on market. Condos recorded a median sold price of $247,000, down 6.79 percent, while new condo listings doubled to 78 (FMLS, August 2026).
August 2026 Month to Date
Metric | Single Family, August 2026 | Change From August 2025 | Condo, August 2026 | Change From August 2025 |
|---|---|---|---|---|
New Listings | 59 | Up 55.26% | 78 | Up 100% |
Sold Listings | 23 | Up 43.75% | 19 | Up 26.67% |
Median List Price (Solds) | $900,000 | Up 0.06% | $269,000 | Up 1.51% |
Median Sold Price | $956,500 | Up 6.99% | $247,000 | Down 6.79% |
Median Days on Market | 13 | Down 60.61% | 26 | Down 38.1% |
Average List Price (Solds) | $1,300,727 | Up 28.65% | $348,721 | Down 14.82% |
Average Sold Price | $1,278,201 | Up 29.94% | $337,573 | Down 15.87% |
Average Days on Market | 26 | Down 44.68% | 44 | Down 37.14% |
List/Sold Price Ratio | 98.3% | Up 0.56% | 95.9% | Down 2.15% |
Market data source: FMLS, August 2026. Figures reflect single-family and condo residential activity in Sandy Springs.
Year to Date Through August 2026
Metric | Single Family, YTD 2026 | Change From YTD 2025 | Condo, YTD 2026 | Change From YTD 2025 |
|---|---|---|---|---|
New Listings | 309 | Up 31.49% | 306 | Up 21.91% |
Sold Listings | 145 | Up 19.83% | 108 | Up 2.86% |
Median List Price (Solds) | $995,000 | Up 4.85% | $295,500 | Down 10.45% |
Median Sold Price | $1,000,000 | Up 5.82% | $285,000 | Down 11.35% |
Median Days on Market | 13 | Unchanged (0%) | 31 | Down 29.55% |
Average List Price (Solds) | $1,426,913 | Up 11.04% | $350,375 | Down 16.39% |
Average Sold Price | $1,402,570 | Up 10.81% | $345,057 | Down 15.71% |
Average Days on Market | 25 | Down 26.47% | 49 | Down 18.33% |
List/Sold Price Ratio | 99.5% | Up 0.38% | 98% | Up 0.47% |
How Did Single-Family Homes Perform in Sandy Springs in August 2026?
Single-family homes performed with firmer pricing and faster sales. The median sold price reached $956,500, up from $894,000, and 23 homes sold compared with 16 a year earlier. Median days on market fell to 13 from 33, and the list to sale price ratio rose to 98.3 percent from 97.8 percent (FMLS, August 2026).
Prices Across the Upper End
The average sold price rose 29.94 percent to $1,278,201, a faster gain than the median, which typically reflects more closings at higher price points. Year to date, the median sold price stands at $1,000,000, up 5.82 percent from $945,000 (FMLS, August 2026). List and sold medians are calculated independently, so the median sold price can sit above the median list price.
Supply and Pace
New listings rose to 59 from 38, yet average days on market still dropped to 26 from 47. Year to date, median days on market held flat at 13.
How Did the Sandy Springs Condo Market Perform in August 2026?
Sandy Springs condos saw more supply and softer prices. New condo listings doubled to 78 from 39, while 19 condos sold, up from 15. The median sold price eased to $247,000 from $265,000, and the list to sale price ratio slipped to 95.9 percent from 98 percent (FMLS, August 2026).
Condo Pricing Trends
Year to date, the condo median sold price is $285,000, down 11.35 percent from $321,500, and the average sold price is $345,057, down 15.71 percent. The median list price for sold condos edged up 1.51 percent to $269,000, which, alongside the lower ratio, points to more negotiation this month.
Condo Days on Market
Condos still sold faster. Median days on market fell to 26 from 42, and the average dropped to 44 from 70 (FMLS, August 2026).
Where Is Inventory Concentrated by Price Band in Sandy Springs?
Single-family inventory is concentrated at the top of the market, with the $1.5M and above band holding the most active listings and nothing listed under $500K. Condo inventory clusters in the $200K to $299K band. Months supply sits near 3.3 for single-family homes and about 7 for condos (FMLS, August 2026).
Single-Family Inventory by Price Band
Active Listings and Months Supply
- $1.5M and above: about 41 active listings
- $1M to $1.5M: about 19
- $750K to $999K: about 14
- $500K to $749K: about 13
Months supply of roughly 3.3 sits slightly above the four-month average of about 3, a level that generally leans toward sellers. Average list price per square foot ranges from about $255 in the lowest bands to about $500 in the $5M and above band.
Days on Market by Price Band
Over the previous 12 months, the $1M to $1.5M band moved fastest at about 23 days, followed by $500K to $749K at about 26 and $750K to $999K at about 27. Homes at $1.5M and above took about 47 days.
Condo Inventory by Price Band
Active Listings and Months Supply
- $200K to $299K: about 57 active listings
- $150K to $199K: about 28
- $300K to $499K: about 23
- $500K to $699K: about 16
- $100K to $149K: about 12
- $700K to $1M: about 10
- $1M and above: about 9
Condo months supply reached about 7, above the four-month average of about 6, a reading that generally leans toward buyers.
Days on Market by Price Band
Over the previous 12 months, condos at $1M and above sold fastest at about 20 days, while the $150K to $199K band was slowest at about 79 days.
What Does the August 2026 Market Mean for Buyers in Sandy Springs?
For buyers, the message depends on property type. Single-family shoppers face quick sales and limited room to negotiate, with a 98.3 percent list to sale price ratio and a median of 13 days on market. Condo shoppers have more choice and more leverage, with about 7 months of supply and a 95.9 percent ratio (FMLS, August 2026).
Single-Family Buyers
- Settle on search criteria before touring Sandy Springs homes for sale, since the median home sold in 13 days.
- Expect offers to land close to list price.
- The $1.5M and above band offers the most listings and the longest average market times.
Condo Buyers
- With 78 new listings in August, selection expanded considerably.
- The 95.9 percent ratio indicates more room for negotiation.
- The $200K to $299K band holds the widest selection.
What Should Sellers in Sandy Springs Know Right Now?
Single-family sellers are working with firm demand, reflected in a year-to-date median sold price of $1,000,000 and a 99.5 percent year-to-date list to sale price ratio. Condo sellers face more competition, since new listings doubled and the August ratio dipped to 95.9 percent. Accurate pricing matters in both segments (FMLS, August 2026).
Single-Family Sellers
- New listings rose 55.26 percent, so pricing and presentation help a home stand out.
- Homes between $1M and $1.5M sold fastest, at about 23 days on average.
- At $1.5M and above, plan for a longer timeline of about 47 days.
Condo Sellers
- The median sold price fell 6.79 percent to $247,000.
- About 7 months of supply gives buyers alternatives to compare.
- A market analysis based on recent closed sales helps set a competitive list price.
Sandy Springs Market Outlook: Reading the August 2026 Trends
The trends describe a two-speed market. Single-family activity shows rising year-to-date prices, steady speed and months supply near 3.3, which points to continued seller leverage if conditions hold. The condo segment shows growing supply, lower year-to-date prices and a softer August ratio, conditions that generally give buyers more room (FMLS, August 2026).
Location Context
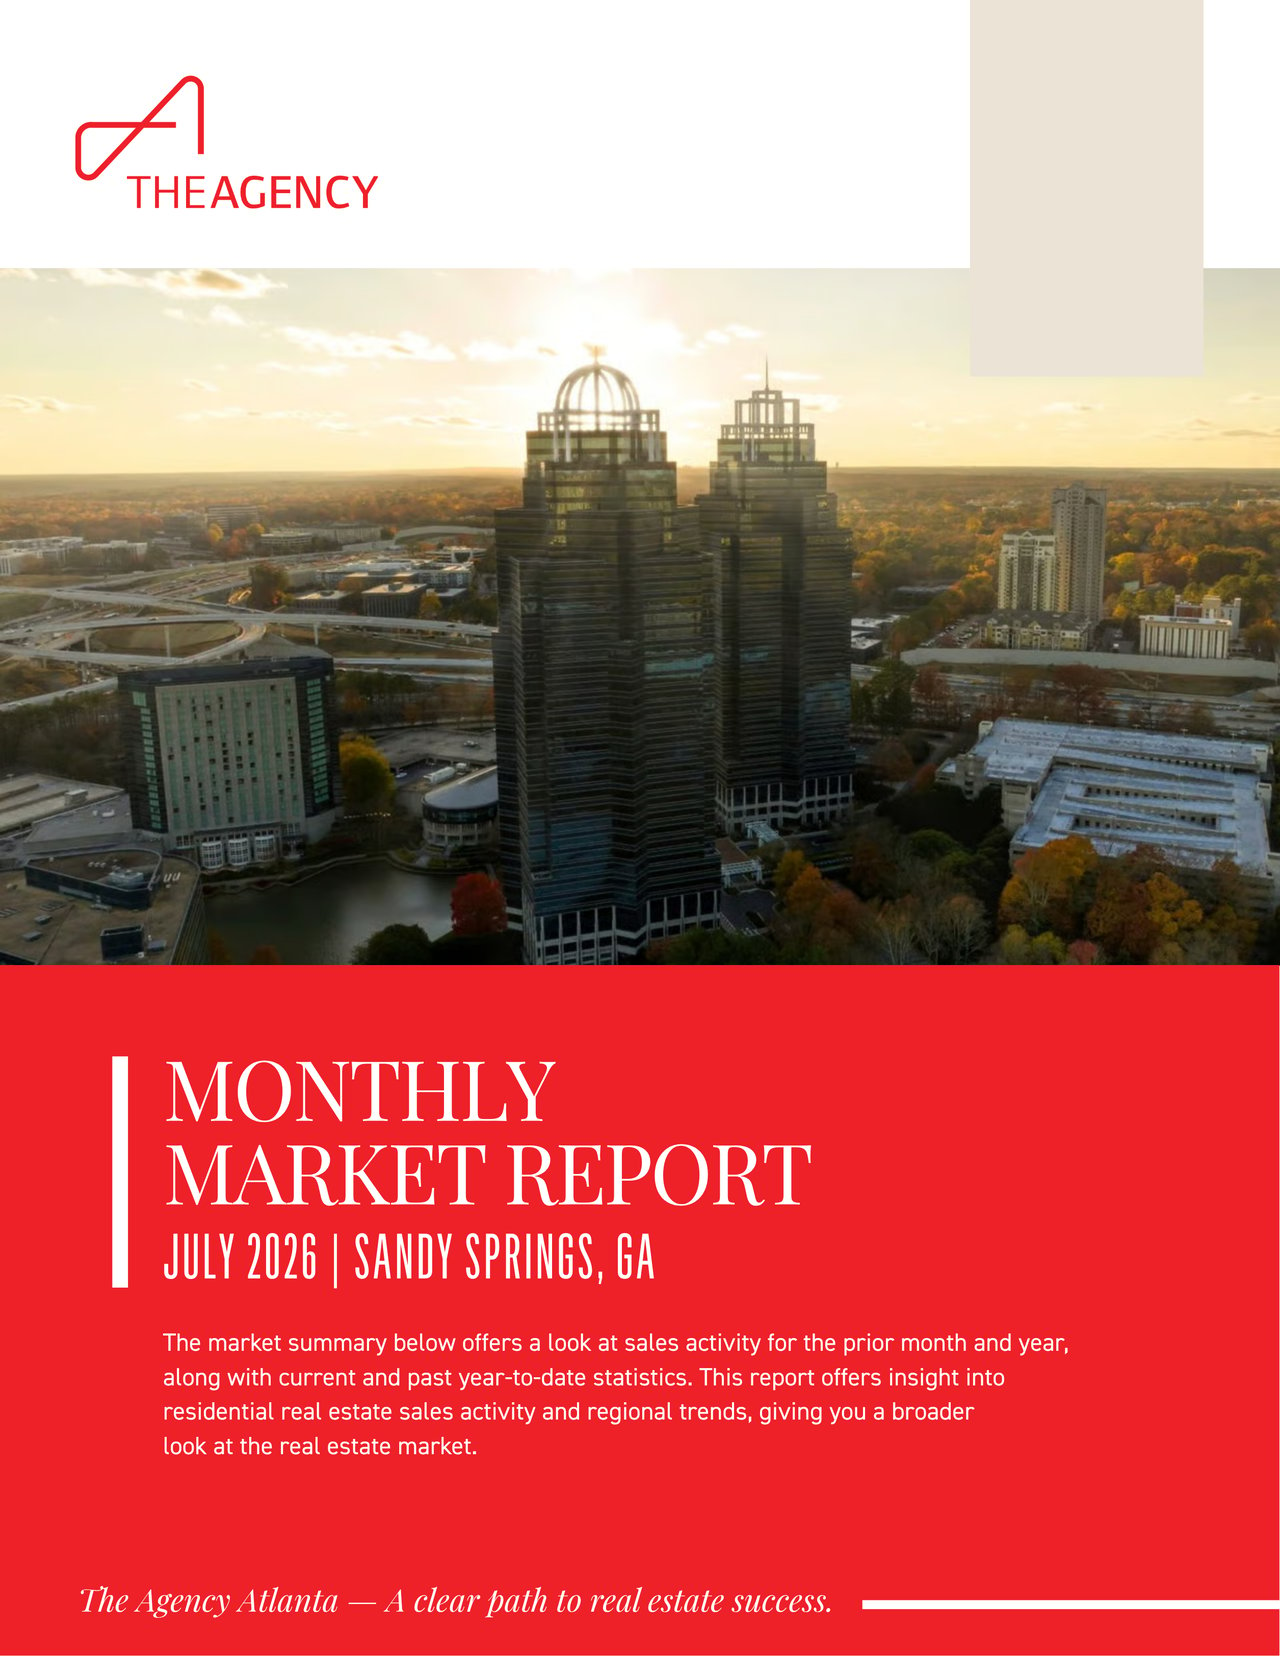
Sandy Springs borders Buckhead to the south and Dunwoody to the east, with access via GA 400 and I-285 and rail service at the Sandy Springs and North Springs MARTA stations. Perimeter Center lies along the city's eastern edge. Landmarks include City Springs, Heritage Sandy Springs, Morgan Falls Overlook Park and the Chattahoochee River, and Roswell Road, Abernathy Road, Hammond Drive, Riverside Drive and Mount Vernon Highway serve as key corridors. The Sandy Springs neighborhood guide offers more detail.
Signals to Watch
- Single-family months supply relative to its four-month average
- Condo new listings compared with condo sales
- The condo list to sale price ratio
The Georgia Association of REALTORS offers statewide context for these Fulton County real estate readings, which describe recorded activity rather than a forecast.
Frequently Asked Questions About the Sandy Springs Real Estate Market
The questions below address what buyers and sellers most often ask about Sandy Springs in August 2026, including median prices, days on market, condo supply and overall market balance. Each answer draws only on FMLS figures for August 2026 and the year to date.
What is the median home price in Sandy Springs in August 2026?
The median sold price for single-family homes in Sandy Springs was $956,500 in August 2026, up 6.99 percent from $894,000 in August 2025. For condos, the median sold price was $247,000, down 6.79 percent from $265,000. Year to date, the single-family median is $1,000,000 and the condo median is $285,000 (FMLS, August 2026).
How fast are homes selling in Sandy Springs?
Single-family homes sold in a median of 13 days in August 2026, compared with 33 days in August 2025. Condos sold in a median of 26 days, down from 42. Speed varies by price band: over the previous 12 months, single-family homes between $1M and $1.5M averaged about 23 days, while condos between $150K and $199K averaged about 79 days (FMLS, August 2026).
Is Sandy Springs a buyer's market or a seller's market?
It depends on property type. Single-family homes had roughly 3.3 months of supply in August 2026 and a 98.3 percent list to sale price ratio, readings that generally lean toward sellers. Condos had about 7 months of supply and a 95.9 percent ratio, which generally leans toward buyers (FMLS, August 2026). Conditions also vary by price band.
Why did condo prices soften while single-family prices rose?
FMLS data for August 2026 shows condo new listings doubled to 78 while condo sales rose to 19, and months supply reached about 7. More available units generally give buyers more options, which can pressure prices. Single-family homes had about 3.3 months of supply and more closings at higher price points. Monthly figures reflect a limited number of sales, so year-to-date trends add context.
What Are the Key Takeaways From Sandy Springs in August 2026?
Three takeaways stand out. Single-family homes in Sandy Springs are selling quickly, with a median of 13 days on market and a $956,500 median sold price. Condo buyers have more selection, with new listings doubled and about 7 months of supply. In both segments, pricing works best when it reflects conditions in the specific price band (FMLS, August 2026).
To talk through how these trends apply to a purchase or sale, connect with an agent at The Agency Atlanta.