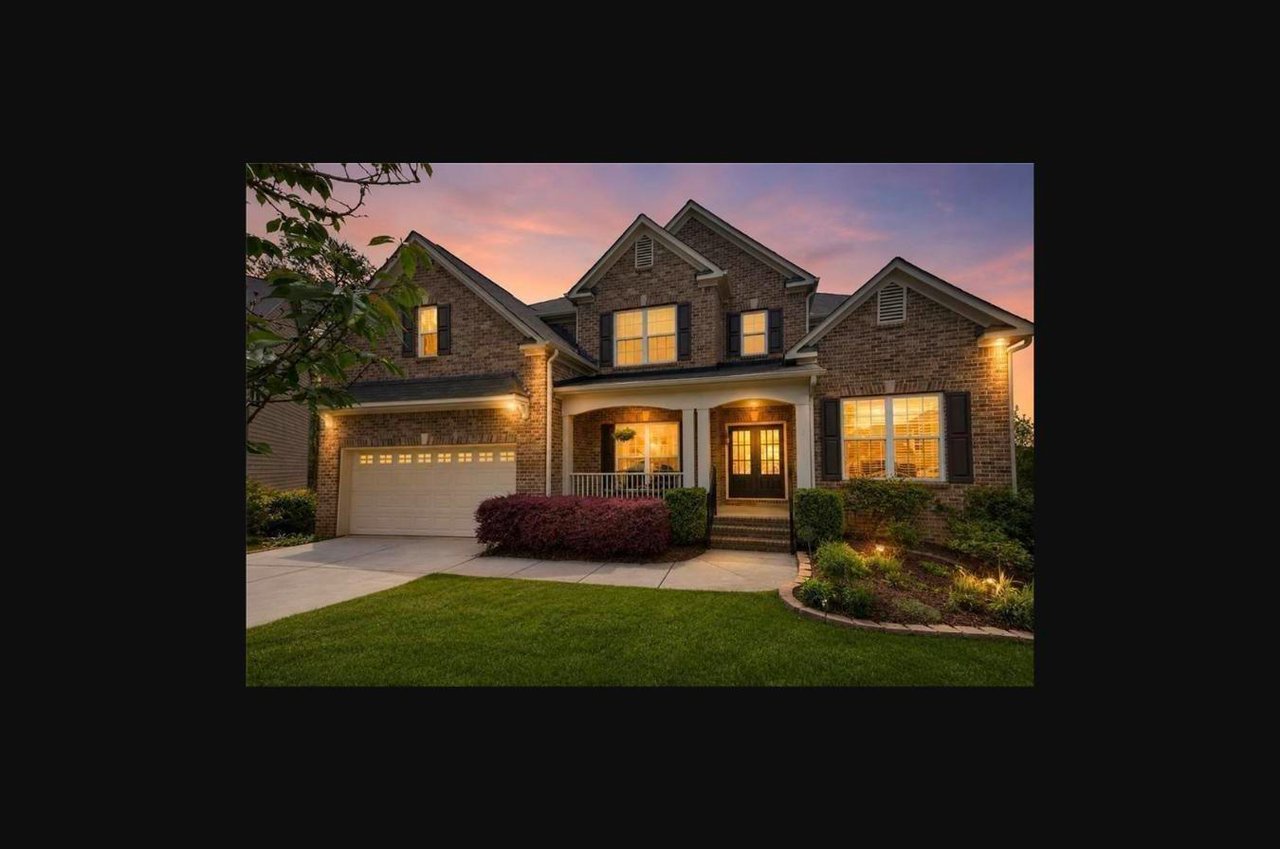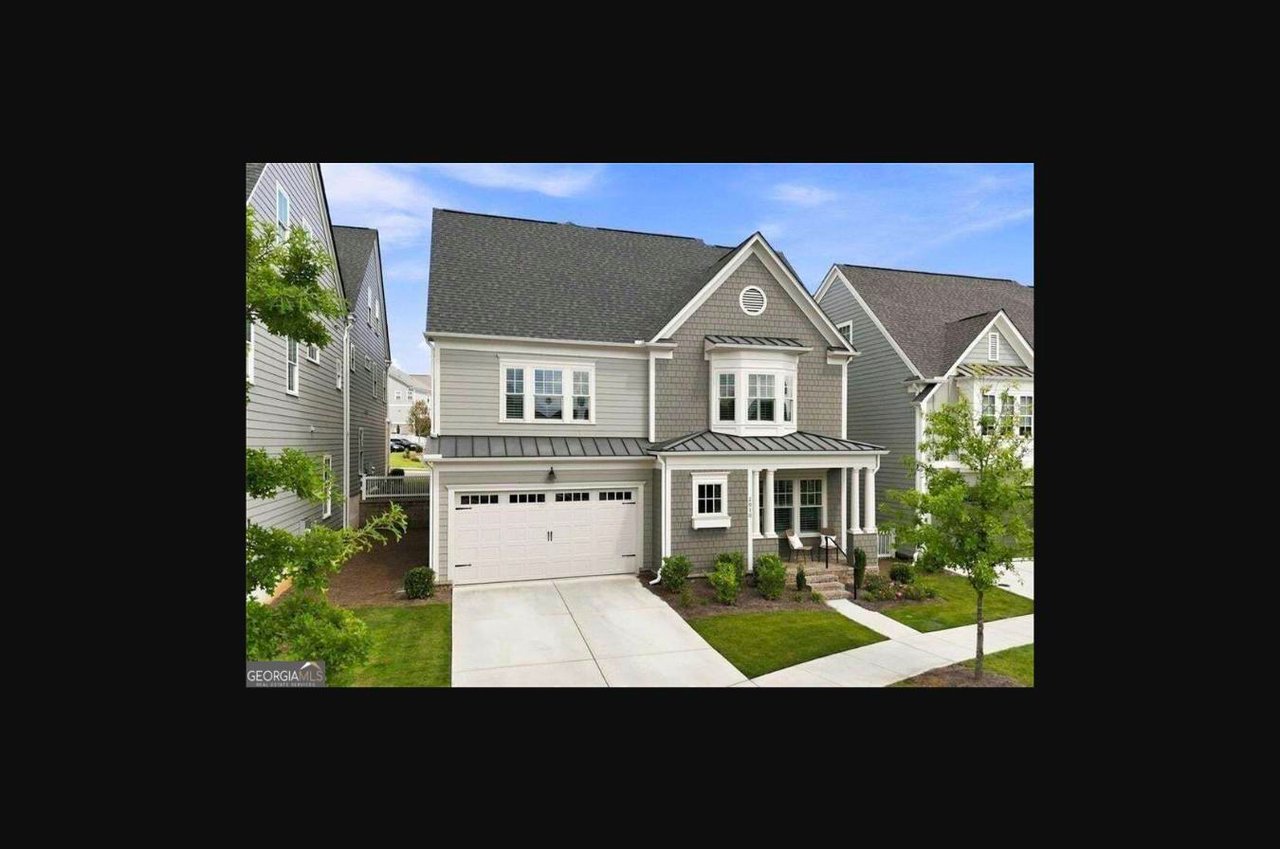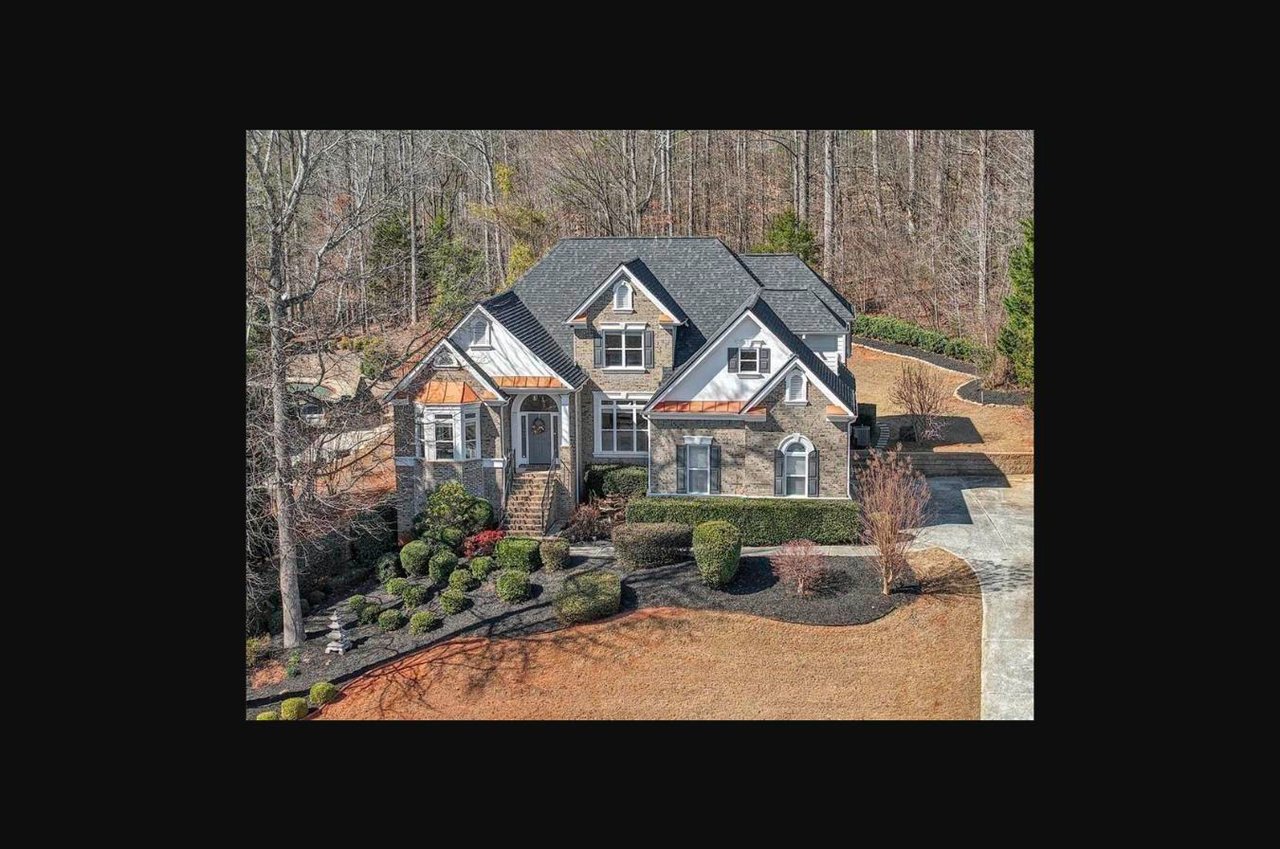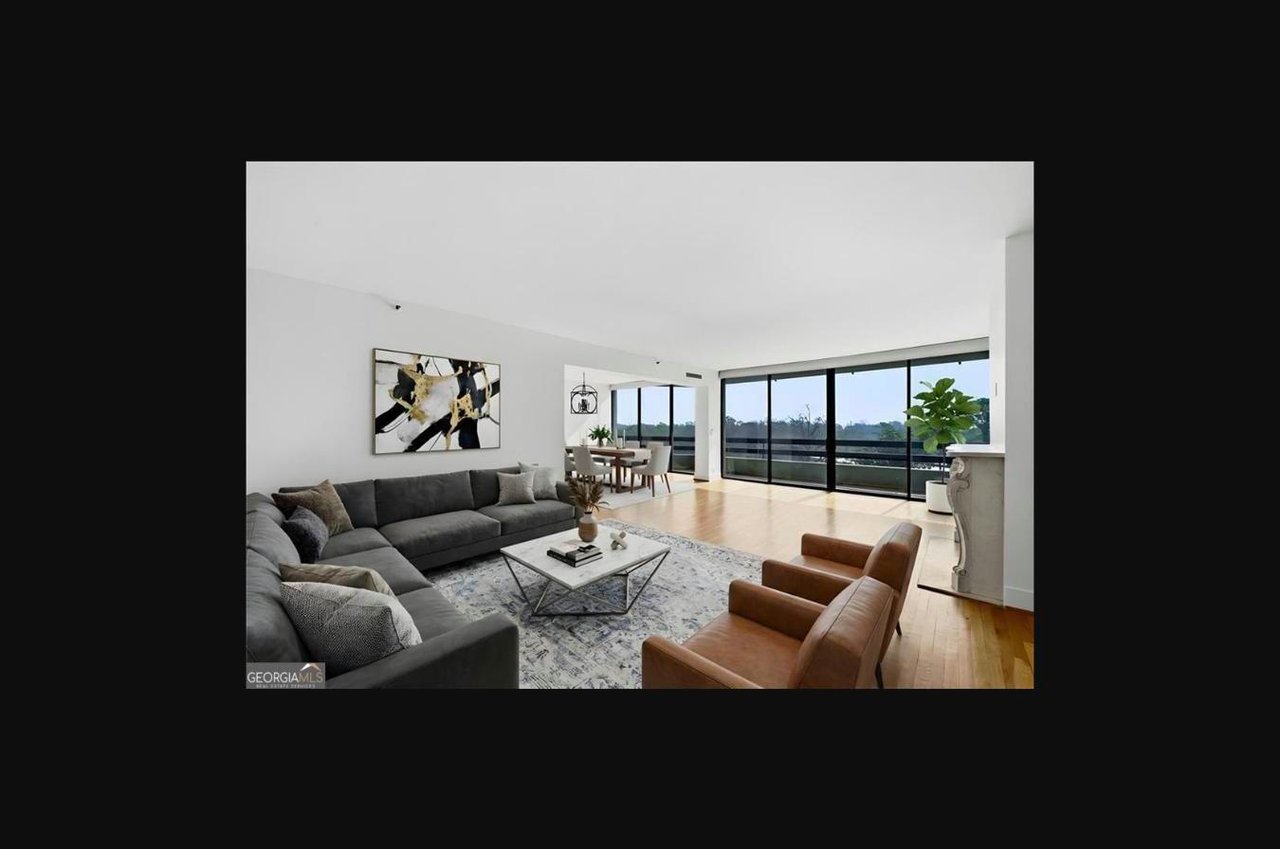
How Sandy Springs single-family homes and condos performed in September 2026, according to FMLS
New condo listings in Sandy Springs reached 76 in September 2026, up 192.31 percent from 26 a year earlier (FMLS, September 2026). That jump in supply sets the tone for the Sandy Springs real estate market September 2026, and single-family homes followed a similar path with 52 new listings, up 126.09 percent. Sales rose in both segments, while the single-family median sold price came in below September 2025 and the condo median moved higher.
This Sandy Springs real estate market update covers both property types across Sandy Springs, Georgia, in Fulton County: key numbers, inventory by price band, months supply, and what the figures mean for buyers and sellers. For the prior month, see the Sandy Springs real estate market report for August 2026.
What Are the Key Numbers in the Sandy Springs Real Estate Market September 2026?
September 2026 brought more listings, more sales and longer selling times for Sandy Springs single-family homes. The single-family median sold price was $900,000, down 28 percent from $1,250,000, with 27 sales and a median of 24 days on market. Condos posted a median sold price of $327,000, up 5.48 percent, with 27 sales and a median of 19 days on market (FMLS, September 2026).
Single-Family Homes
Metric | September 2026 | September 2025 | Change | YTD 2026 | YTD 2025 |
|---|---|---|---|---|---|
New Listings | 52 | 23 | Up 126.09% | 366 | 257 |
Sold Listings | 27 | 15 | Up 80% | 174 | 136 |
Median Sold Price | $900,000 | $1,250,000 | Down 28% | $992,450 | $947,000 |
Average Sold Price | $1,385,036 | $1,282,620 | Up 7.98% | $1,393,687 | $1,267,610 |
Median Days on Market | 24 | 9 | Up 166.67% | 15 | 12 |
Average Days on Market | 38 | 28 | Up 35.71% | 27 | 33 |
List/Sold Price Ratio | 97.5% | 97.7% | Down 0.26% | 99.1% | 99% |
Market data source: FMLS, September 2026. Figures reflect single-family residential activity in Sandy Springs.
Condos
Metric | September 2026 | September 2025 | Change | YTD 2026 | YTD 2025 |
|---|---|---|---|---|---|
New Listings | 76 | 26 | Up 192.31% | 384 | 280 |
Sold Listings | 27 | 14 | Up 92.86% | 133 | 119 |
Median Sold Price | $327,000 | $310,000 | Up 5.48% | $285,000 | $321,500 |
Average Sold Price | $383,025 | $401,571 | Down 4.62% | $351,367 | $412,502 |
Median Days on Market | 19 | 24 | Down 20.83% | 26 | 38 |
Average Days on Market | 31 | 38 | Down 18.42% | 43 | 55 |
List/Sold Price Ratio | 98.2% | 98.6% | Down 0.43% | 98% | 97.6% |
Market data source: FMLS, September 2026. Figures reflect condo residential activity in Sandy Springs.
Why the Single-Family Median and Average Diverged
The single-family median fell while the average rose 7.98 percent, which points to a wider spread of sale prices this September rather than a uniform shift. With 27 closed sales, a handful of higher-priced transactions can lift the average while the midpoint sits lower. Year to date, both measures run above 2025 (FMLS, September 2026).
How Is Inventory Spread Across Sandy Springs Price Bands?
Single-family inventory in Sandy Springs leans toward the upper bands, with $1.5 million and above holding the most active listings and nothing listed under $500K. Condo inventory concentrates in the $200K to $299K band. FMLS data for September 2026 shows about 3.3 months of single-family supply and about 6.3 months of condo supply.
Single-Family Inventory by Price Band
- $1.5M and above: about 47 active listings, the largest group
- $1M to $1.5M: about 25
- $750K to $999K: about 19
- $500K to $749K: about 13
- Under $500K: none
Single-Family Price per Square Foot
FMLS data for September 2026 shows list price per square foot ranging from about $245 in bands under $1M to about $560 in the $5M to $7M band.
Condo Inventory by Price Band
- $200K to $299K: about 78 active listings, the largest group
- $300K to $499K: about 27
- $150K to $199K: about 23
- $500K to $699K: about 19
- $700K to $1M: about 15
- $100K to $149K and $1M and above: about 13 and 12
Months Supply and Days on Market
Single-family months supply sits at about 3.3, slightly below about 3.5 in August, a level generally associated with seller-leaning conditions. Condo supply eased to about 6.3 months from about 8.2 in August, a level generally read as balanced to buyer-leaning (FMLS, September 2026). Over the previous 12 months, days on market varied by band:
- Single-family $1M to $1.5M: about 25 days, the fastest band
- Single-family $1.5M and above: about 48 days, the slowest band
- Condo $1M and above: about 9 days, the fastest condo band
- Condo $150K to $199K: about 74 days, the slowest condo band
What Does the September 2026 Data Mean for Buyers in Sandy Springs?
Buyers in Sandy Springs have more to choose from than a year ago. New listings rose sharply in both segments, single-family median days on market lengthened to 24, and list to sale ratios sat slightly below September 2025. Together, those figures point to more room for careful comparison and negotiation, especially in the upper single-family bands (FMLS, September 2026).
Single-Family Buyers
- Wider selection: 52 new listings, against 23 a year earlier
- More time to decide: a median of 24 days on market and an average of 38
- Pricing context: a list to sale price ratio of 97.5 percent
Condo Buyers
Condo buyers face a quicker pace, with median days on market down to 19 and a list to sale price ratio of 98.2 percent. The $200K to $299K band carries the deepest inventory, giving buyers there the widest set of Sandy Springs condos for sale to compare (FMLS, September 2026).
Practical Steps for Buyers
- Compare recent closed sales within a specific price band rather than citywide medians.
- Note days on market for each listing, since longer exposure can open room for discussion.
- Weigh commute access to GA 400, I-285 and nearby MARTA stations.
What Does the September 2026 Data Mean for Sellers in Sandy Springs?
Sellers in Sandy Springs face more competition from new listings than a year ago, yet sales volume also rose in both segments. Single-family homes sold at a 97.5 percent list to sale ratio and condos at 98.2 percent (FMLS, September 2026). Accurate pricing and strong presentation matter more when buyers have additional homes for sale in Sandy Springs to compare.
Single-Family Sellers
- Sales rose 80 percent to 27, so demand remains active alongside higher supply.
- A median of 24 days on market suggests planning for a longer marketing window than last September.
- Year to date, the list to sale ratio of 99.1 percent sits slightly above 99 percent in 2025.
Condo Sellers
Condo sales rose 92.86 percent to 27, and median days on market fell to 19. With 76 new condo listings in September, pricing in line with recent closed sales in the same band helps a listing stand apart (FMLS, September 2026).
Seller Preparation Checklist
- Start with a current market analysis and price opinion based on comparable closed sales.
- Prioritize presentation: professional photography, light staging and clear floor plans.
How Does Location Shape the Sandy Springs Market?
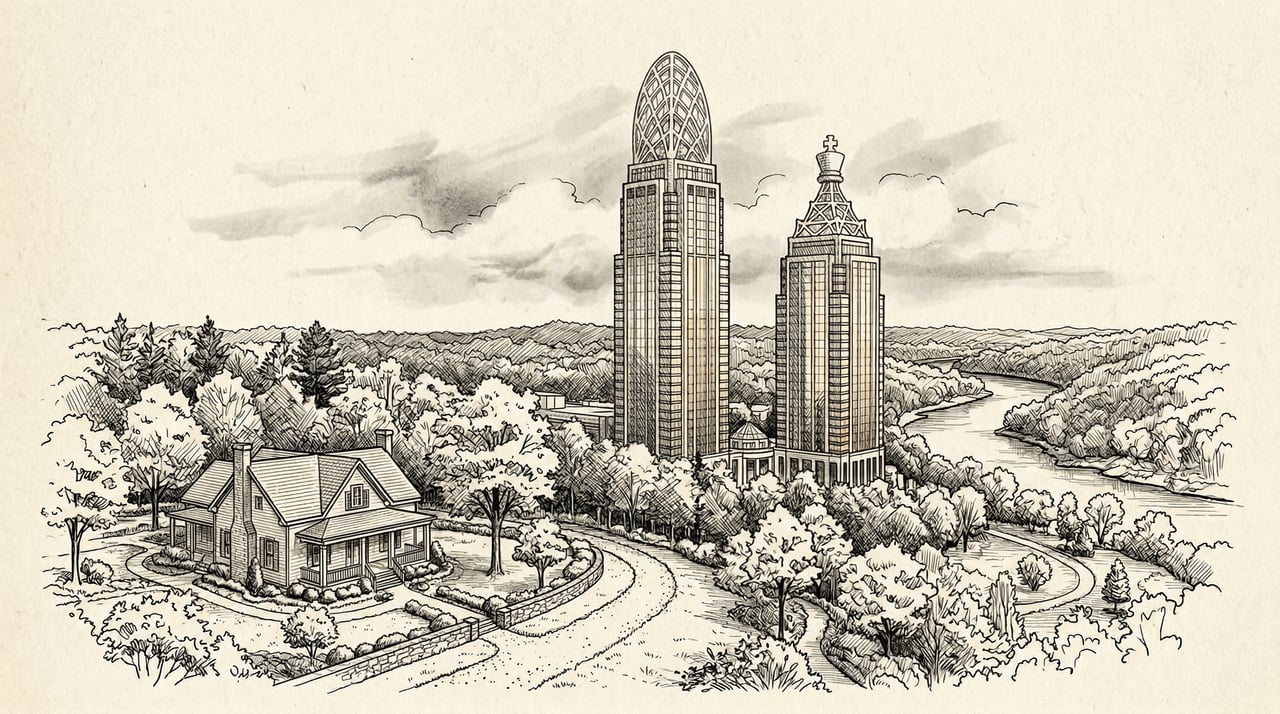
Location in Sandy Springs is shaped largely by access and landmarks. GA 400 runs north and south through the city, I-285 crosses it east to west, and the Sandy Springs and North Springs MARTA stations serve commuters. Neighboring Buckhead sits to the south and Dunwoody to the east, which places Sandy Springs within reach of both.
Corridors and Landmarks
- Roswell Road: the main north and south corridor, with City Springs and Heritage Sandy Springs nearby
- Abernathy Road and Hammond Drive: east and west connectors toward GA 400 and Perimeter Center
- Mount Vernon Highway and Riverside Drive: secondary routes connecting residential areas
- Morgan Falls Overlook Park: green space along the Chattahoochee River
How Location Connects to the Data
FMLS figures for September 2026 are citywide, so individual corridors can perform differently than the medians suggest. The Sandy Springs neighborhood guide offers more local context.
What Do the Trends Suggest for the Sandy Springs Market?
The September 2026 data suggests a market absorbing higher supply while sales continue to grow. Listings and sales rose together in both segments, single-family selling times lengthened, and condo months supply eased from about 8.2 to about 6.3. These are observations of current conditions, not a statement about where prices go next (FMLS, September 2026).
Signals Worth Watching
- Months supply: single-family near 3.3 and condo near 6.3
- Year-to-date pace: single-family sales up 27.94 percent and condo sales up 11.76 percent
Reading the Year-to-Date Picture
Year to date, the single-family median sold price is up 4.8 percent, while the condo median sold price is down 11.35 percent (FMLS, September 2026). Source data comes from First Multiple Listing Service (FMLS), and statewide context is available from the Georgia Association of REALTORS.
Sandy Springs Real Estate FAQ for September 2026
The questions below address what buyers and sellers most often ask about Sandy Springs homes for sale and condos. Each answer draws only on FMLS data for September 2026 and year to date, so the figures reflect citywide activity for single-family homes and condos in Sandy Springs, Georgia.
What was the median sold price for a single-family home in Sandy Springs in September 2026?
The median sold price for a single-family home in Sandy Springs was $900,000 in September 2026, down 28 percent from $1,250,000 in September 2025 (FMLS, September 2026). Year to date, the median sold price stands at $992,450, compared with $947,000 for the same period of 2025. Because the monthly figure rests on 27 sales, the year-to-date number offers a broader view of pricing.
Are Sandy Springs condos selling faster than last year?
Yes. Median days on market for Sandy Springs condos fell to 19 in September 2026 from 24 in September 2025, and average days on market fell to 31 from 38 (FMLS, September 2026). Year to date, median condo days on market are 26, against 38 in 2025. Speed still varies by band, with the $1M and above range moving fastest over the previous 12 months.
Is Sandy Springs a buyer's market or a seller's market right now?
The answer depends on property type. Single-family homes show about 3.3 months of supply in September 2026, a level generally associated with seller-leaning conditions, though longer days on market give buyers more time than a year ago. Condos show about 6.3 months of supply, generally read as balanced to buyer-leaning (FMLS, September 2026). Conditions also vary by price band.
How should sellers approach pricing a Sandy Springs home this fall?
Pricing works best when grounded in recent closed sales of the same property type and price band. In September 2026, single-family homes sold at a 97.5 percent list to sale price ratio and condos at 98.2 percent (FMLS, September 2026). With new listings up sharply in both segments, a listing priced in line with comparable sales tends to draw attention sooner. A current market analysis from a local agent provides a price opinion specific to the property.
Key Takeaways From the Sandy Springs Market in September 2026
September 2026 brought Sandy Springs a sharp rise in new listings for both single-family homes and condos, alongside higher sales counts. Single-family homes sold at a lower median price and took longer to sell than a year ago, while condos sold at a higher median price and moved faster, according to FMLS data for the month.
Single-family supply remains near 3.3 months, while condo supply eased to about 6.3 months, so conditions differ by property type and price band. For guidance on buying or selling in Sandy Springs, connect with an agent at The Agency Atlanta.