Higher median prices, fewer closings and rising supply shape September in Cobb County
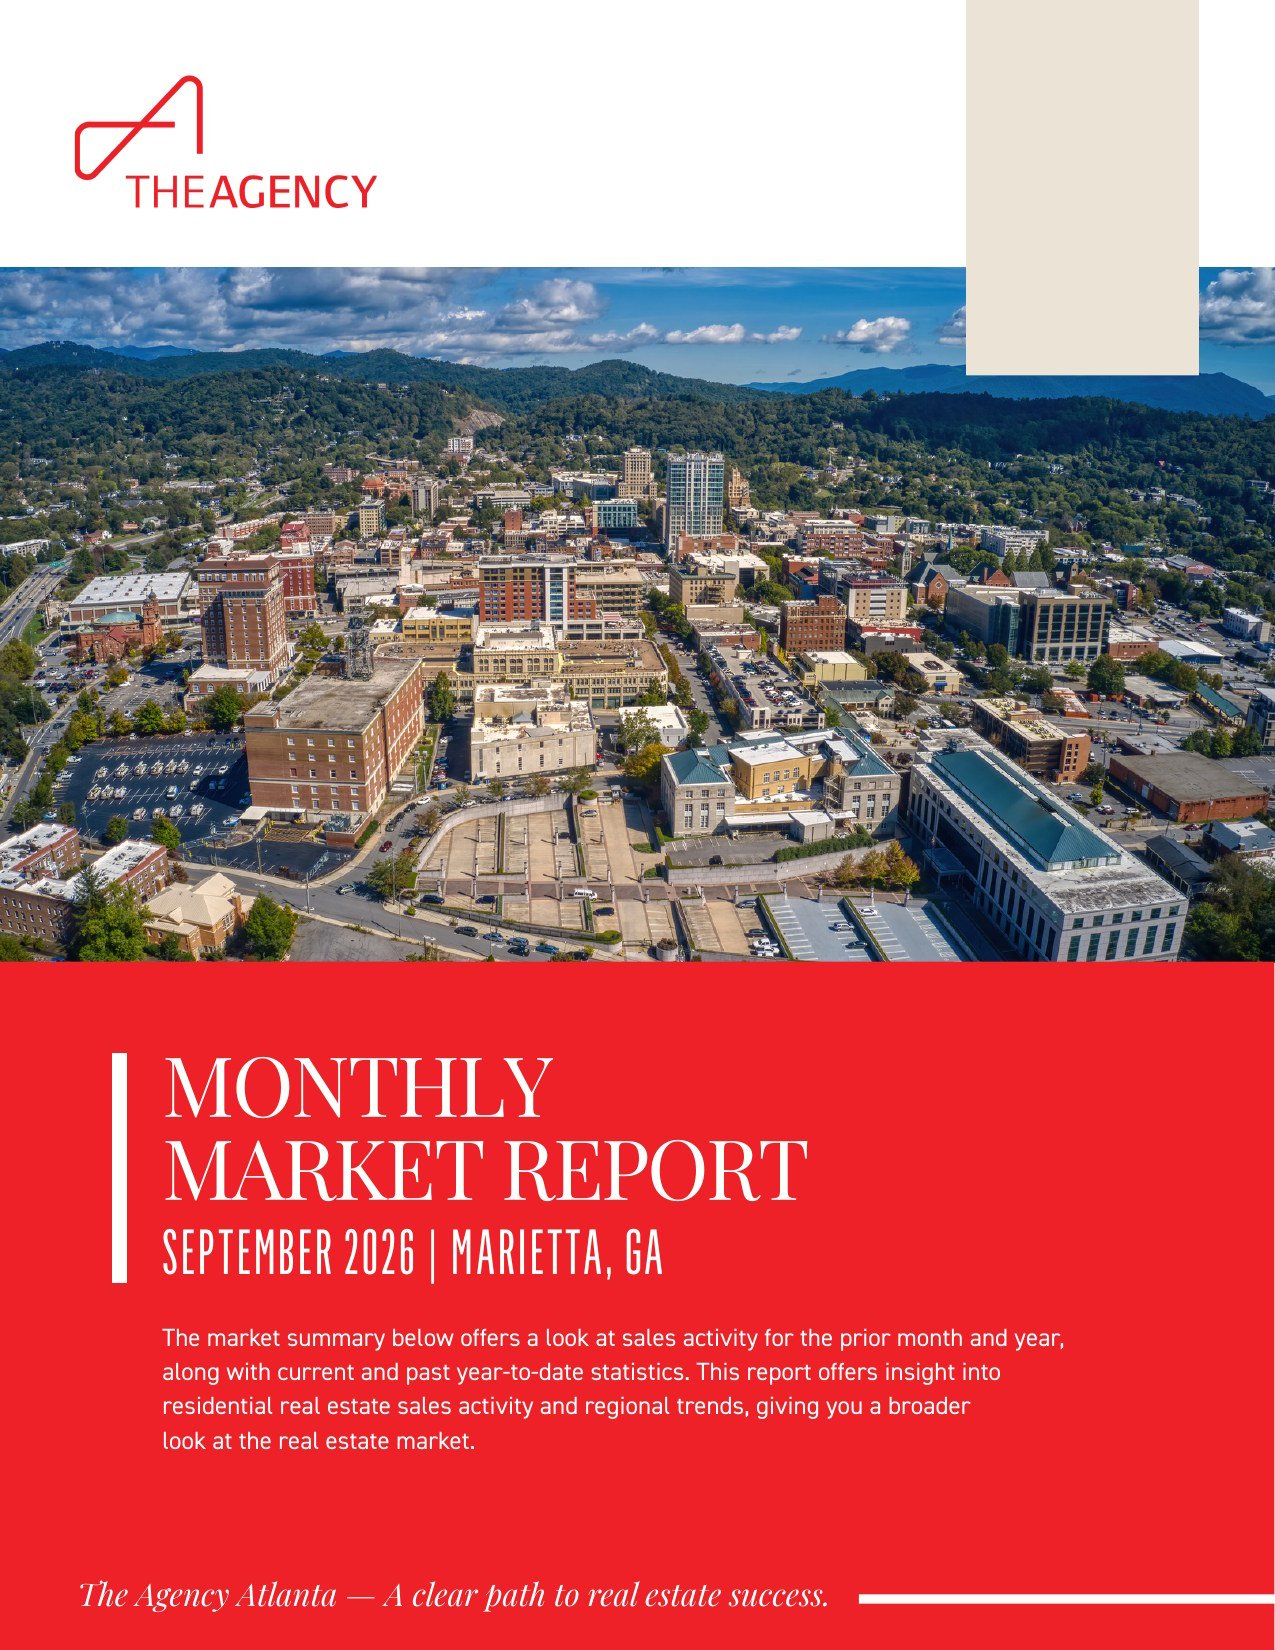
Single-family homes in Cobb County closed at a median sold price of $481,500 in September 2026, up 5.82 percent from $455,000 a year earlier (FMLS, September 2026). That gain arrived alongside fewer closings and a longer typical time on market, a combination that defines the Cobb County real estate market September 2026 picture. This report covers countywide single-family activity across Marietta, Smyrna, Kennesaw, Acworth, Powder Springs and Austell, along with unincorporated communities such as East Cobb, Mableton and Vinings.
The sections below cover the key numbers, pace of sales, inventory by price band and what the data means for buyers and sellers. For the prior month, see the Cobb County real estate market report for August 2026.
What Happened in the Cobb County Real Estate Market September 2026?
Cobb County single-family prices rose year over year in September 2026 while transaction volume cooled. The median sold price reached $481,500, up 5.82 percent, and the average sold price reached $576,719, up 4.44 percent. Sold listings fell 12.85 percent to 529, and new listings dipped 4.16 percent to 898 (FMLS, September 2026). Year to date, the median sold price is flat at $475,000.
September 2026 Single-Family Snapshot
The table below summarizes countywide single-family figures from First Multiple Listing Service (FMLS), comparing September 2026 with September 2025 and year to date totals.
Metric | September 2026 | September 2025 | Change | YTD 2026 | YTD 2025 | YTD Change |
|---|---|---|---|---|---|---|
New Listings | 898 | 937 | Down 4.16% | 9,221 | 8,920 | Up 3.37% |
Sold Listings | 529 | 607 | Down 12.85% | 5,461 | 5,381 | Up 1.49% |
Median List Price (Solds) | $489,900 | $459,900 | Up 6.52% | $483,500 | $479,000 | Up 0.94% |
Median Sold Price | $481,500 | $455,000 | Up 5.82% | $475,000 | $475,000 | Flat (0%) |
Median Days on Market | 26 | 23 | Up 13.04% | 23 | 20 | Up 15% |
Average List Price (Solds) | $590,629 | $566,205 | Up 4.31% | $577,389 | $574,953 | Up 0.42% |
Average Sold Price | $576,719 | $552,186 | Up 4.44% | $567,211 | $565,920 | Up 0.23% |
Average Days on Market | 39 | 41 | Down 4.88% | 40 | 37 | Up 8.11% |
List to Sold Price Ratio | 98% | 97.7% | Up 0.33% | 98.4% | 98.6% | Down 0.14% |
Market data source: FMLS, September 2026. Figures reflect Single Family residential activity in Cobb County, Georgia.
Prices Climbed While Volume Eased
The median list price for homes that sold rose 6.52 percent to $489,900 (FMLS, September 2026). September's median sold price of $481,500 sits above the year to date median of $475,000. Monthly figures reflect the mix of homes that closed, so the year to date reading offers a steadier view.
How Quickly Are Cobb County Homes Selling?
Homes are taking somewhat longer to sell. The median days on market rose to 26 in September 2026 from 23 a year earlier, up 13.04 percent, while the average days on market eased to 39 from 41, down 4.88 percent (FMLS, September 2026). The list to sold price ratio reached 98 percent, a slight improvement from 97.7 percent.
Median and Average Days on Market
The median reflects the typical home, while the average is pulled upward by listings that linger. Year to date, the median days on market stands at 23, up 15 percent from 20, and the average stands at 40, up 8.11 percent from 37 (FMLS, September 2026).
List to Sold Price Ratio
A 98 percent ratio in September 2026 shows homes still selling close to list price. The year to date ratio of 98.4 percent is down 0.14 percent from 98.6 percent, a small shift that points to modest negotiating room.
Days on Market by Price Band
FMLS data for September 2026 shows these approximate average days on market over the previous 12 months:
- $100K to $149K: about 35 days, the fastest band
- $150K to $199K: about 38 days
- $500K to $699K: about 40 days
- $200K to $299K and $700K to $1M: about 41 days each
- $300K to $499K and $1M+: about 42 days each
- $0 to $99K: about 49 days
Most bands cluster within a few days of one another, so pricing and condition tend to matter more than price band alone.
Where Is Cobb County Inventory Concentrated?
Active single-family inventory at the end of September 2026 was heaviest in the $300K to $499K band, with roughly 1,050 listings, according to FMLS data for September 2026. The $500K to $699K band followed with about 555 listings. Months supply rose to about 4.0, up from about 3.6 in August, the highest reading since early 2026.
Active Listings by Price Band
- $300K to $499K: about 1,050 active listings
- $500K to $699K: about 555
- $700K to $1M: about 385
- $1M+: about 195
- $200K to $299K: about 150
- Under $200K: very few
Months Supply of Inventory
Months supply stood at about 4.0 in September 2026, compared with about 3.6 in August and about 2.5 in spring 2026, while the four month average sits near 3. A reading near four months is generally viewed as closer to balanced than the tighter spring conditions.
New Listings and Sales Year to Date
Year to date, new listings total 9,221, up 3.37 percent from 8,920, while sold listings total 5,461, up 1.49 percent from 5,381 (FMLS, September 2026). New supply has grown faster than closings in 2026, which helps explain the rise in months supply.
What Does the Cobb County Market Mean for Buyers?
Buyers in Cobb County have more room to evaluate options than they did in spring. Months supply near 4.0, a median of 26 days on market and fewer September closings point to a less hurried pace (FMLS, September 2026). Prices remain firm, though, with the median sold price at $481,500 and the list to sold price ratio at 98 percent.
More Choice in the Core Price Bands
The $300K to $499K and $500K to $699K bands hold the largest share of active listings, according to FMLS data for September 2026, allowing time to compare cities, home styles and commute routes.
Practical Steps for Buyers
- Review recent closed sales in the specific city or community, since countywide medians blend very different areas.
- Note how long an individual listing has been active compared with the countywide median of 26 days.
- Map commute routes along I-75, I-285, I-575 and I-20 before narrowing a search.
- Be ready to act on well-priced homes, which still close near list price.
What Does the Cobb County Market Mean for Sellers?
Sellers still hold solid footing on price but face more competition and a longer typical timeline. The median sold price rose 5.82 percent to $481,500 and the list to sold price ratio reached 98 percent, yet median days on market climbed to 26 and months supply rose to about 4.0 (FMLS, September 2026).
Pricing Against Active Competition
With roughly 1,050 active listings in the $300K to $499K band alone, buyers can compare similar homes at once. A list price grounded in a current market analysis of nearby closed sales helps a home stand out early.
Preparing a Listing for Today's Conditions
- Complete visible repairs and cosmetic updates before the listing goes live.
- Use professional photography and accurate property details.
- Review days on market within the home's price band to set realistic timing expectations.
How Do Location and Access Vary Across Cobb County?
Cobb County spans six cities and several large unincorporated communities, each with different housing stock, price points and access. Countywide FMLS figures for September 2026 blend all of these areas, so a local market analysis for a specific city or community gives a sharper read than the county median alone.
Cities, Communities and Landmarks
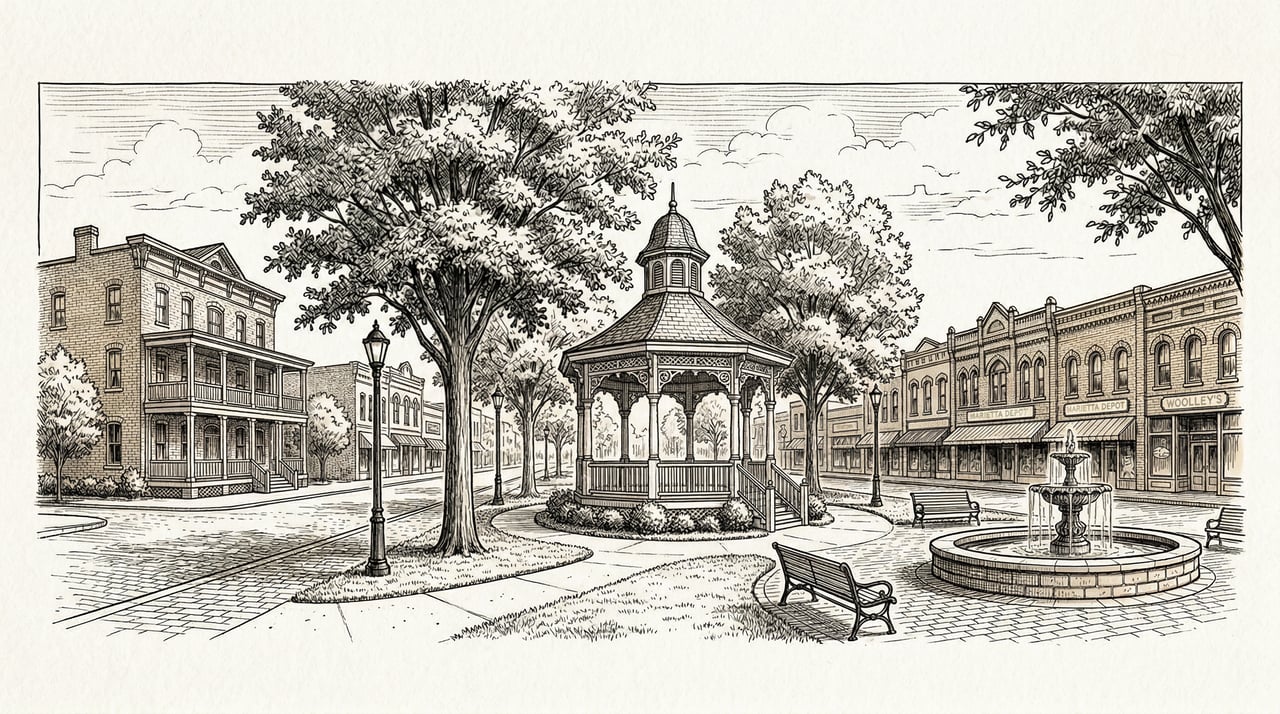
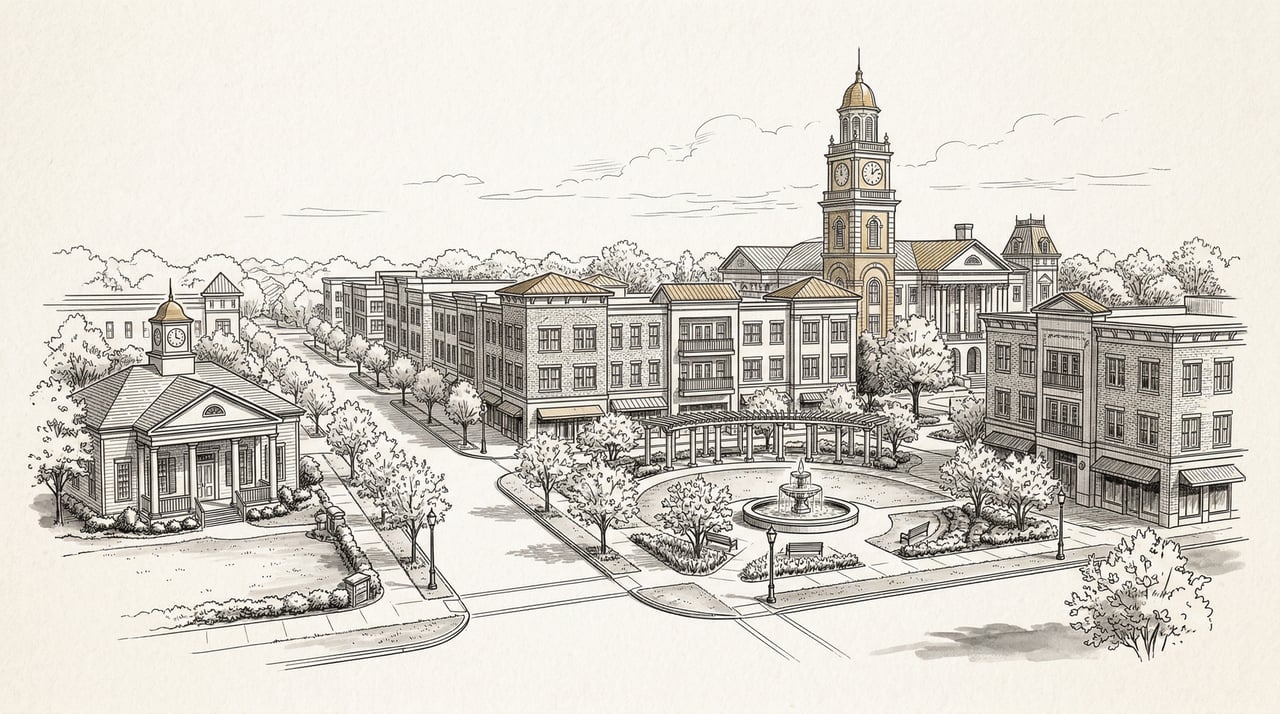
Marietta Square anchors the county seat, and Kennesaw Mountain National Battlefield Park sits between Marietta and Kennesaw. Lake Acworth lies within Acworth. The Cumberland area near Smyrna and Vinings is home to The Battery Atlanta and Truist Park, and the Chattahoochee River National Recreation Area runs along the county's eastern edge near East Cobb. The Silver Comet Trail crosses the county from Smyrna westward through Mableton and Powder Springs.
Major Access Routes
- I-75 runs through the center of the county, connecting Cumberland, Marietta, Kennesaw and Acworth.
- I-285 crosses the southeastern corner near Cumberland, Smyrna and Vinings.
- I-575 branches north from I-75 near Marietta and Kennesaw.
- I-20 runs along the south, near Austell and Mableton.
To compare individual cities and communities in more detail, explore the Cobb County neighborhood guide.
What Do the September 2026 Trends Suggest for Cobb County?
The data points toward a market moving gradually from tight conditions toward balance. Rising months supply, fewer closings and a longer median time on market sit alongside firm year over year price gains and a 98 percent list to sold price ratio (FMLS, September 2026). This reads as moderation in pace rather than weakness in pricing.
Signals to Watch
- The direction of months supply after reaching about 4.0 in September 2026
- The balance between new listings and sold listings in upcoming reports
- Movement in the list to sold price ratio, which reflects negotiating room
Statewide Context
For broader context, the Georgia Association of REALTORS publishes statewide housing data that can help frame countywide figures. This outlook is analysis of reported data, not a statement about future prices.
Frequently Asked Questions About Cobb County Single-Family Homes
The most common questions about the Cobb County market center on current prices, market balance, selling time and inventory by price band. The answers below draw only on FMLS data for September 2026, reflecting countywide single-family figures rather than conditions in any one city or community.
What was the median home price in Cobb County in September 2026?
The median sold price for single-family homes in Cobb County was $481,500 in September 2026, up 5.82 percent from $455,000 in September 2025 (FMLS, September 2026). The median list price for homes that sold was $489,900, up 6.52 percent. Year to date, the median sold price is $475,000, unchanged from the same period in 2025.
Is Cobb County a buyer's or seller's market right now?
Months supply reached about 4.0 in September 2026, up from about 3.6 in August and about 2.5 in spring 2026, according to FMLS data for September 2026. That reading is generally viewed as closer to balanced than the tighter spring conditions. Homes still sold at a 98 percent list to sold price ratio, so sellers retain pricing strength while buyers gain more choice and time.
How long does it take to sell a home in Cobb County?
The median days on market for Cobb County single-family homes was 26 in September 2026, up from 23 in September 2025, while the average was 39 days, down from 41 (FMLS, September 2026). Across the previous 12 months, most price bands averaged roughly 38 to 42 days. Actual timing depends on pricing, condition and location within the county.
Which price range has the most homes for sale in Cobb County?
The $300K to $499K band held the most active single-family listings at the end of September 2026, with roughly 1,050 homes, according to FMLS data for September 2026. The $500K to $699K band followed with about 555 listings, then $700K to $1M with about 385. The $1M+ tier held about 195 listings.
Key Takeaways on the Cobb County Housing Market
Cobb County single-family prices rose year over year in September 2026, with a median sold price of $481,500. Closings slowed, the median days on market lengthened to 26 and the year to date median sold price held at $475,000. Months supply near 4.0 signals a market moving toward balance, giving buyers more choice while well-priced homes still sell near list price (FMLS, September 2026).
For guidance on buying or selling a single-family home anywhere in the county, connect with an agent at The Agency Atlanta.