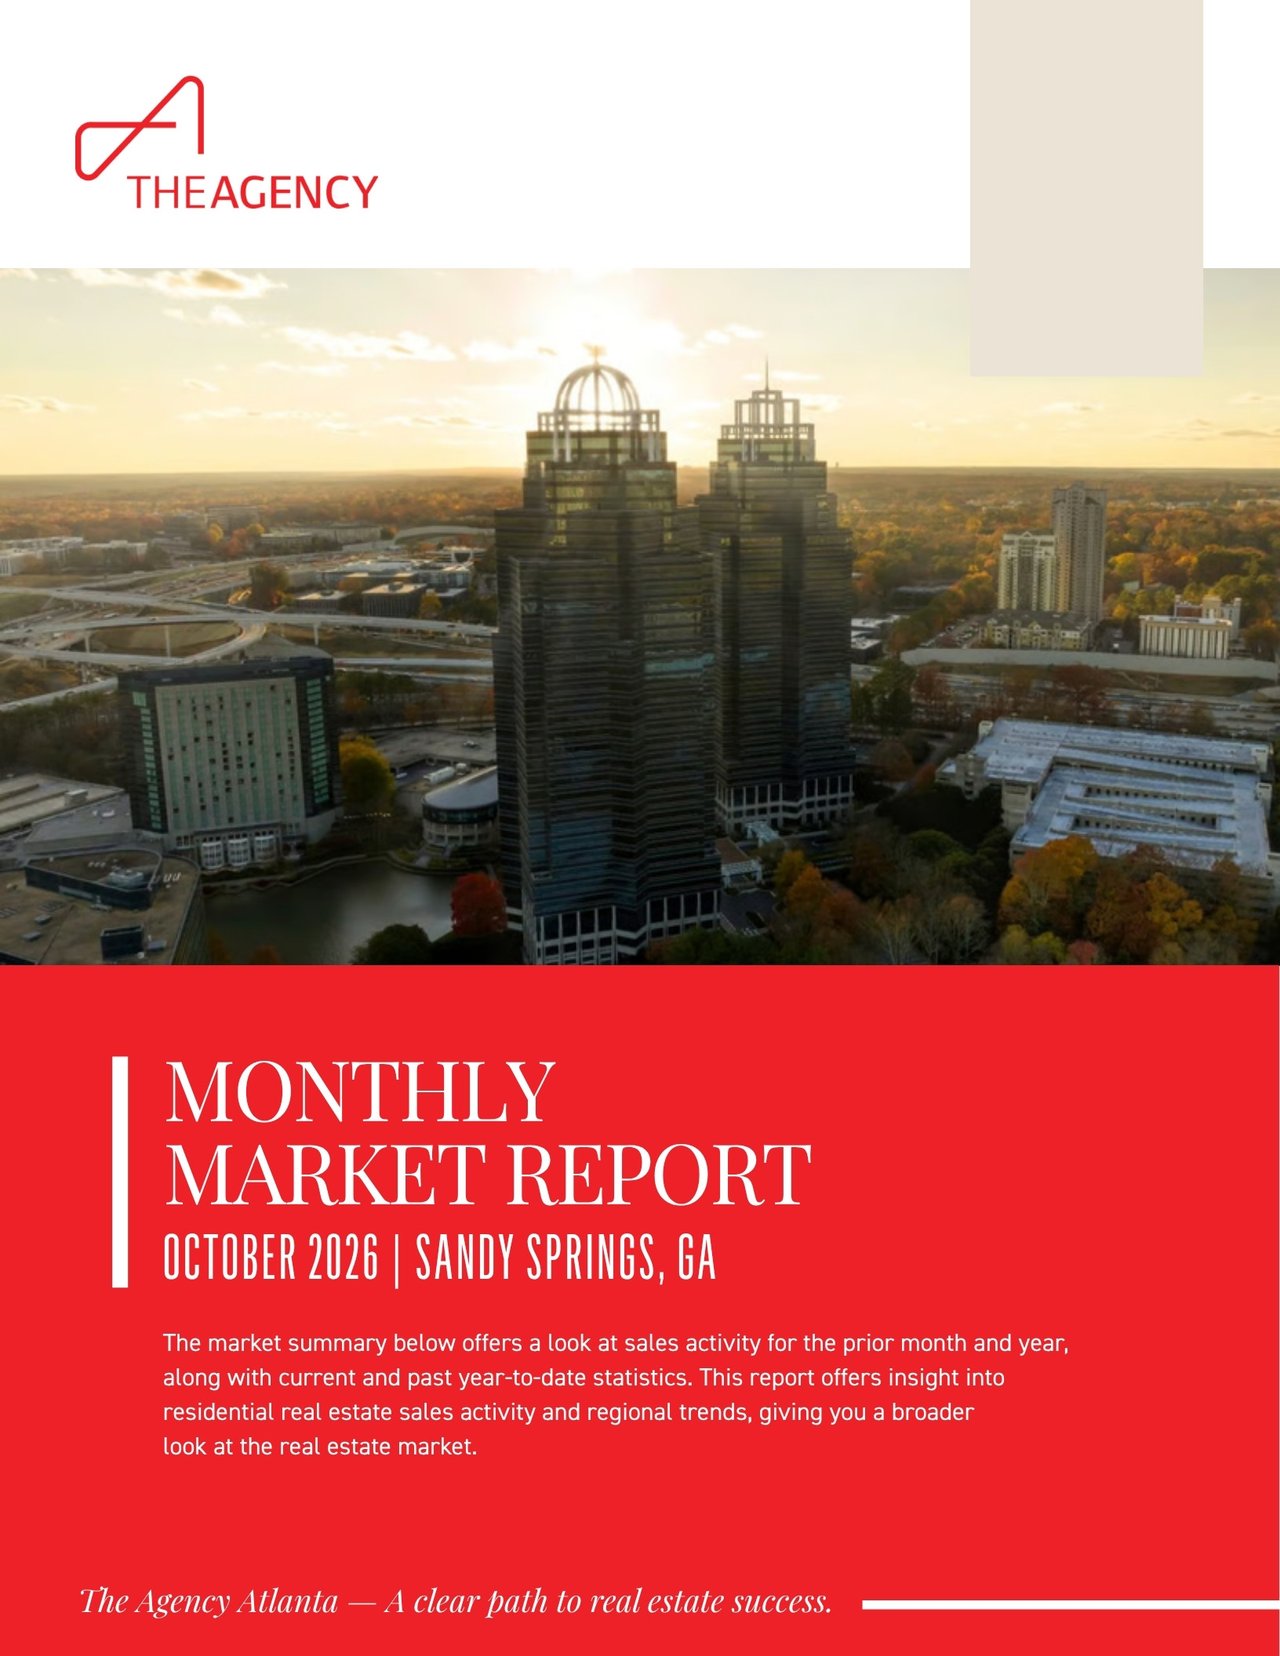
Sales and listings surged in October as single family prices rose and condo prices fell.
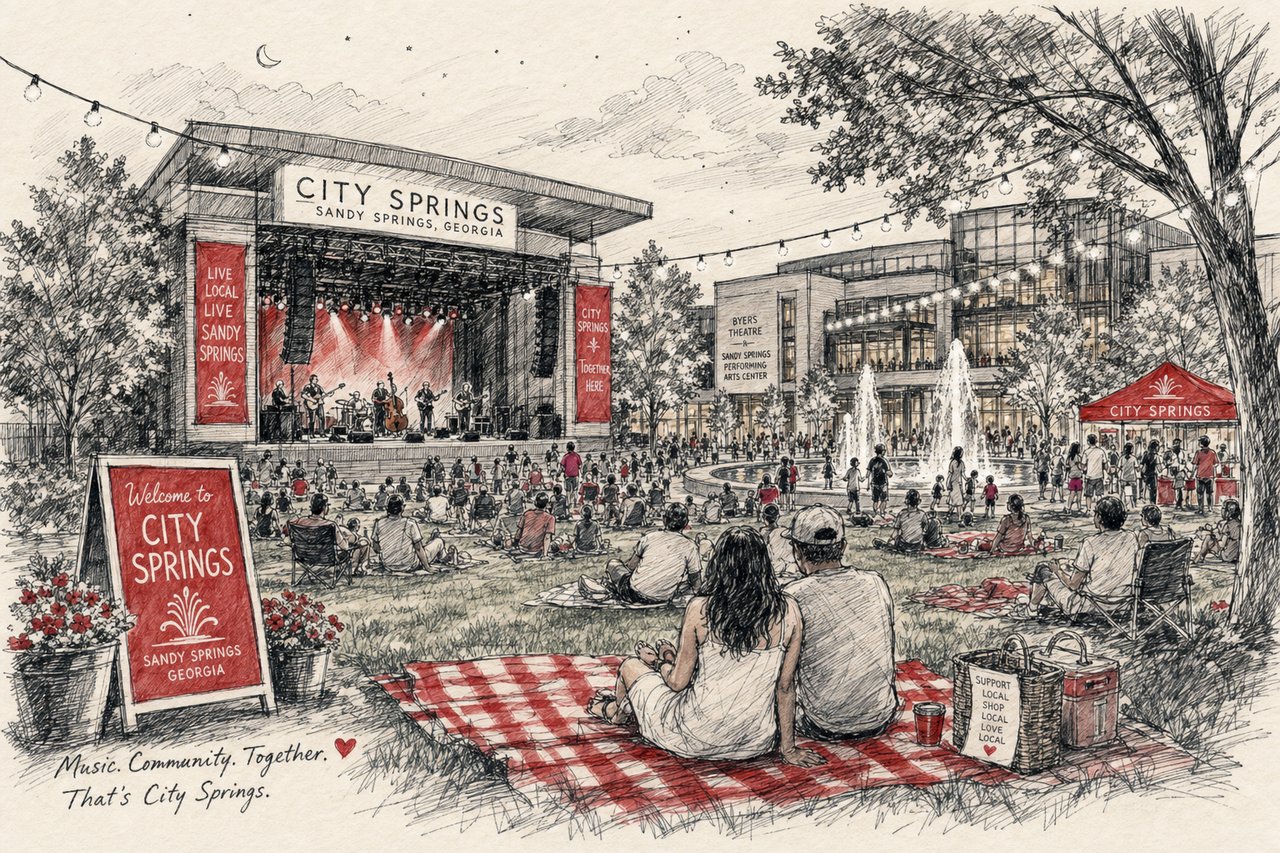
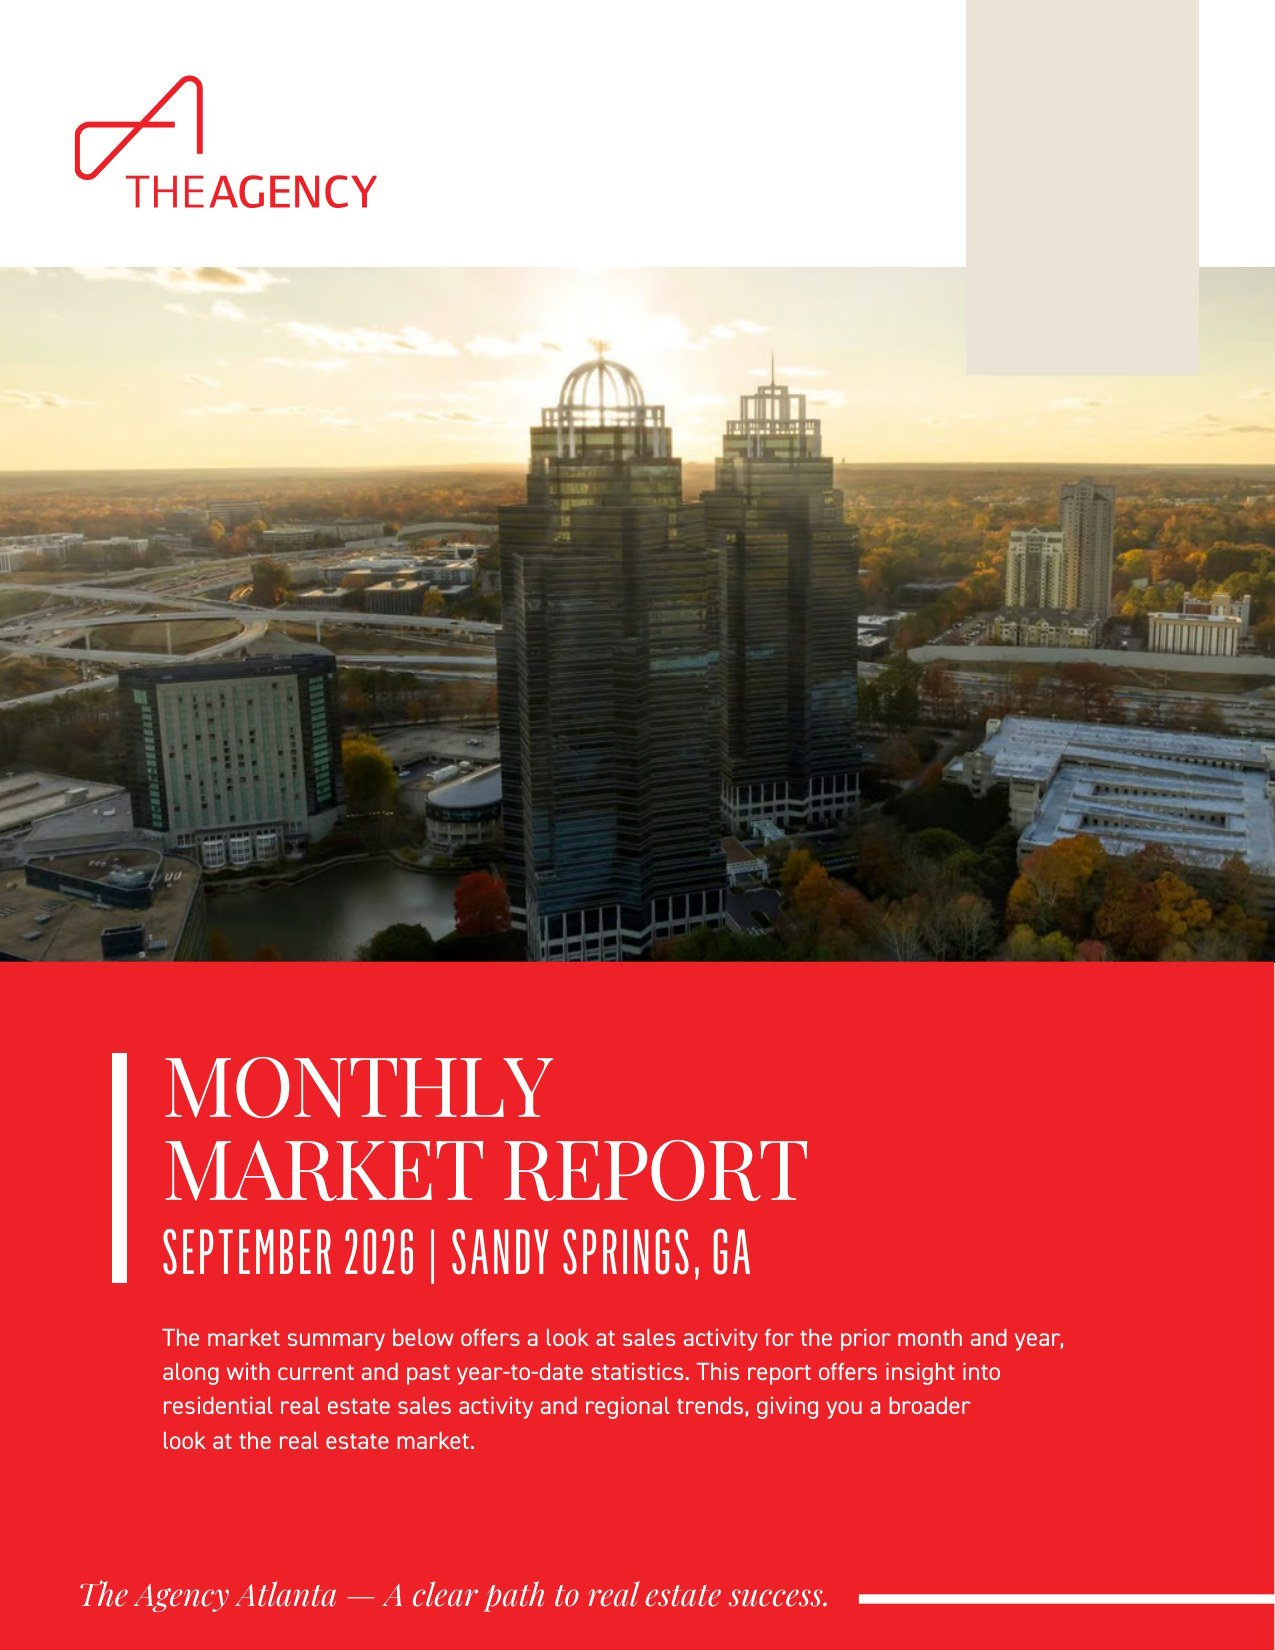
Sandy Springs recorded 65 new single family listings in October 2026, up 261.11% from 18 in October 2025, and 31 single family homes closed, up 93.75% (FMLS, October 2026). Condos showed similar growth in activity, with 73 new listings and 22 sales. This Sandy Springs real estate market October 2026 report covers both segments for the month and for January through October, explains what the figures mean for buyers and sellers, and reads the trend without predicting it. Sandy Springs is a Fulton County city with distinct areas, from the offices and retail around Perimeter Center to the civic and dining hub at City Springs, so citywide figures are a starting point. For the previous month, see the September 2026 Sandy Springs report.
What Does the Sandy Springs Real Estate Market October 2026 Report Show?
Sandy Springs single family homes closed 31 sales in October 2026 at a median sold price of $1,225,000, with a median of 18 days on market. Condos closed 22 sales at a median sold price of $243,749 and a median of 20 days on market. Activity grew in both segments compared with October 2025 (FMLS, October 2026).
Single Family Homes: October 2026 and Year to Date
The table compares October 2026 with October 2025, and January through October 2026 (YTD 2026) with the same months of 2025 (YTD 2025).
Metric | October 2026 | October 2025 | Change | YTD 2026 | YTD 2025 | YTD Change |
|---|---|---|---|---|---|---|
New Listings | 65 | 18 | Up 261.11% | 426 | 277 | Up 53.79% |
Sold Listings | 31 | 16 | Up 93.75% | 205 | 152 | Up 34.87% |
Median List Price (Solds) | $1,195,000 | $957,500 | Up 24.8% | $998,000 | $949,500 | Up 5.11% |
Median Sold Price | $1,225,000 | $931,250 | Up 31.54% | $1,000,000 | $940,000 | Up 6.38% |
Median Days on Market | 18 | 37 | Down 51.35% | 14 | 12 | Up 16.67% |
Average List Price (Solds) | $1,433,158 | $1,058,993 | Up 35.33% | $1,436,723 | $1,248,524 | Up 15.07% |
Average Sold Price | $1,392,424 | $1,020,887 | Up 36.39% | $1,402,530 | $1,228,383 | Up 14.18% |
Average Days on Market | 33 | 46 | Down 28.26% | 27 | 32 | Down 15.63% |
List/Sold Price Ratio | 96.7% | 96.6% | Up 0.02% | 98.7% | 98.8% | Down 0.09% |
Market data source: FMLS, October 2026. Figures reflect single family residential activity in Sandy Springs.
Condos: October 2026 and Year to Date
Metric | October 2026 | October 2025 | Change | YTD 2026 | YTD 2025 | YTD Change |
|---|---|---|---|---|---|---|
New Listings | 73 | 32 | Up 128.13% | 462 | 311 | Up 48.55% |
Sold Listings | 22 | 18 | Up 22.22% | 159 | 136 | Up 16.91% |
Median List Price (Solds) | $254,950 | $374,500 | Down 31.92% | $289,500 | $327,000 | Down 11.47% |
Median Sold Price | $243,749 | $379,000 | Down 35.69% | $280,000 | $315,000 | Down 11.11% |
Median Days on Market | 20 | 38 | Down 47.37% | 27 | 37 | Down 27.03% |
Average List Price (Solds) | $362,041 | $454,555 | Down 20.35% | $355,474 | $421,024 | Down 15.57% |
Average Sold Price | $351,738 | $445,416 | Down 21.03% | $349,026 | $411,852 | Down 15.25% |
Average Days on Market | 38 | 56 | Down 32.14% | 43 | 56 | Down 23.21% |
List/Sold Price Ratio | 96.8% | 97.3% | Down 0.52% | 97.8% | 97.5% | Up 0.24% |
Market data source: FMLS, October 2026. Figures reflect condo residential activity in Sandy Springs.
How Are Sandy Springs Single Family Homes Selling?
Sandy Springs single family homes sold in greater numbers and at higher prices in October 2026. Closings reached 31 compared with 16, up 93.75%, and the median sold price was $1,225,000 compared with $931,250, up 31.54%. The median time on market was 18 days compared with 37 (FMLS, October 2026).
Activity and Pace
New listings were 65 compared with 18, an increase of 261.11%, so supply arrived much faster than a year earlier. The average days on market fell to 33 from 46, down 28.26%. Year to date, new listings total 426 compared with 277, up 53.79%, and sold listings total 205 compared with 152, up 34.87%.
The year to date median days on market is 14 compared with 12, up 16.67%, while the year to date average of 27 days is below last year's 32, down 15.63%.
Pricing
The median list price of sold homes was $1,195,000, up 24.8% from $957,500. The average sold price was $1,392,424 compared with $1,020,887, up 36.39%. Year to date the median sold price is $1,000,000 compared with $940,000, up 6.38%, and the average sold price is $1,402,530 compared with $1,228,383, up 14.18%.
October's gain is larger than the year to date gain, which suggests the mix of homes that sold in the month leaned toward higher price points. The October list to sold price ratio was 96.7% compared with 96.6%, and the year to date ratio is 98.7% compared with 98.8%.
How Is the Sandy Springs Condo Market Moving?
Sandy Springs condos saw more activity at lower prices in October 2026. Sales rose to 22 from 18, up 22.22%, while the median sold price fell to $243,749 from $379,000, down 35.69%. The median time on market was 20 days compared with 38, down 47.37% (FMLS, October 2026).
October 2026 Results
New condo listings were 73 compared with 32, up 128.13%. The average days on market was 38 compared with 56, down 32.14%. The average sold price was $351,738 compared with $445,416, down 21.03%, and the median list price of sold units was $254,950 compared with $374,500, down 31.92%. The list to sold price ratio was 96.8% compared with 97.3%, down 0.52%.
Lower medians in a month often reflect which units sold, such as smaller floor plans or particular buildings.
Year to Date Results
Year to date, sold listings total 159 compared with 136, up 16.91%, and new listings total 462 compared with 311, up 48.55%. The median sold price is $280,000 compared with $315,000, down 11.11%, and the average sold price is $349,026 compared with $411,852, down 15.25%. The median days on market is 27 compared with 37. The year to date ratio is 97.8% compared with 97.5%, up 0.24%.
What Do the Sandy Springs Numbers Mean for Buyers?
Buyers in Sandy Springs had more choice in October 2026, with 65 new single family listings and 73 new condo listings. Single family homes still moved in a median of 18 days, and condos in 20 days, so timelines remained short for homes that drew interest (FMLS, October 2026).
Single Family Buyers
The October list to sold price ratio of 96.7% compared with 98.7% year to date. That gap hints at somewhat more room between list and sold prices in the month, though it is one month of data. A larger set of new listings makes side by side comparison easier, for buyers focused on areas near Roswell Road, close to the Chattahoochee River and Morgan Falls Overlook Park, or nearer Perimeter Center.
Condo Buyers
Condo buyers saw median sold prices below those of a year earlier and a median of 20 days on market. With 73 new listings in the month, there were many units to compare across buildings. Some buyers prefer being near the MARTA Sandy Springs station or City Springs. The neighborhoods page can help you compare areas before you tour.
What Do the Sandy Springs Numbers Mean for Sellers?
Sandy Springs single family sellers saw strong closing activity and higher median prices in October 2026, with 31 sales and a median sold price of $1,225,000. Condo sellers faced more competing listings and lower median prices than a year earlier, so pricing and presentation carried added weight (FMLS, October 2026).
Single Family Sellers
The average list price of sold homes was $1,433,158 and the average sold price was $1,392,424, with a ratio of 96.7%. Year to date the ratio is 98.7%. Homes priced near recent comparable closings are the ones most likely to match those figures. A market analysis from a local agent, built on the specific street, size and condition of the home, is more precise than any citywide average.
Condo Sellers
With 73 new condo listings in October 2026, sellers share the market with many similar units. The median days on market of 20 shows that units did sell. Clear pricing, strong photography and complete building information help a listing stand out.
Reading the Sandy Springs Trend: What the Data Suggests
The October 2026 figures show a Sandy Springs market with sharply higher supply and sales, higher single family prices and lower condo prices. This is a reading of recent data, not a forecast. Following the same measures month to month is the most reliable way to see if these patterns continue (FMLS, October 2026).
Signals to Watch
- New listings and sales together: single family new listings rose 261.11% and sold listings rose 93.75%. Supply grew faster than sales, which can add to available inventory.
- Price mix: the single family average sold price rose 36.39% in October, compared with 14.18% year to date.
- Condo pricing: the median sold price is down 35.69% in October and down 11.11% year to date.
Limits of the Data
A single month with 31 single family sales and 22 condo sales can shift with a handful of closings. The year to date figures smooth that out, and the numbers describe all of Sandy Springs rather than a single neighborhood or building.
Sandy Springs Real Estate Market FAQ
What was the median sold price in Sandy Springs in October 2026?
The single family median sold price was $1,225,000, compared with $931,250 in October 2025, up 31.54%. The condo median sold price was $243,749, compared with $379,000, down 35.69%. Year to date, the single family median is $1,000,000 compared with $940,000, up 6.38%, and the condo median is $280,000 compared with $315,000, down 11.11% (FMLS, October 2026).
How long did homes take to sell in Sandy Springs in October 2026?
Single family homes had a median of 18 days on market, compared with 37 a year earlier, and an average of 33 days compared with 46. Condos had a median of 20 days compared with 38, and an average of 38 days compared with 56. Year to date, the single family median is 14 days and the condo median is 27 days (FMLS, October 2026).
How many homes sold in Sandy Springs in October 2026?
There were 31 single family sales, compared with 16 in October 2025, up 93.75%, and 22 condo sales, compared with 18, up 22.22%. Year to date there have been 205 single family sales compared with 152, and 159 condo sales compared with 136. New listings in October were 65 for single family homes and 73 for condos (FMLS, October 2026).
Do Sandy Springs homes sell close to the list price?
In October 2026 the list to sold price ratio was 96.7% for single family homes, compared with 96.6% a year earlier, and 96.8% for condos, compared with 97.3%. Year to date the ratio is 98.7% for single family homes and 97.8% for condos. Individual results vary with price, condition and timing (FMLS, October 2026).
Where does this Sandy Springs market data come from?
The figures come from FMLS, the Georgia multiple listing service, for October 2026, and they cover closed sales and new listings reported in the city. Month to date figures compare October 2026 with October 2025, and year to date figures compare January through October 2026 with the same months of 2025. You can learn more at FMLS and at the Georgia Association of Realtors.
Sandy Springs Real Estate Market Takeaways
Three points stand out from October 2026. Single family activity grew, with 31 sales, 65 new listings and a median sold price of $1,225,000. Condos also saw more sales, at 22, but the median sold price was $243,749, below the $379,000 of a year earlier. Year to date, the single family median is $1,000,000 while the condo median is $280,000. To talk through what these figures mean for your own plans, contact The Agency Atlanta to schedule a consultation.