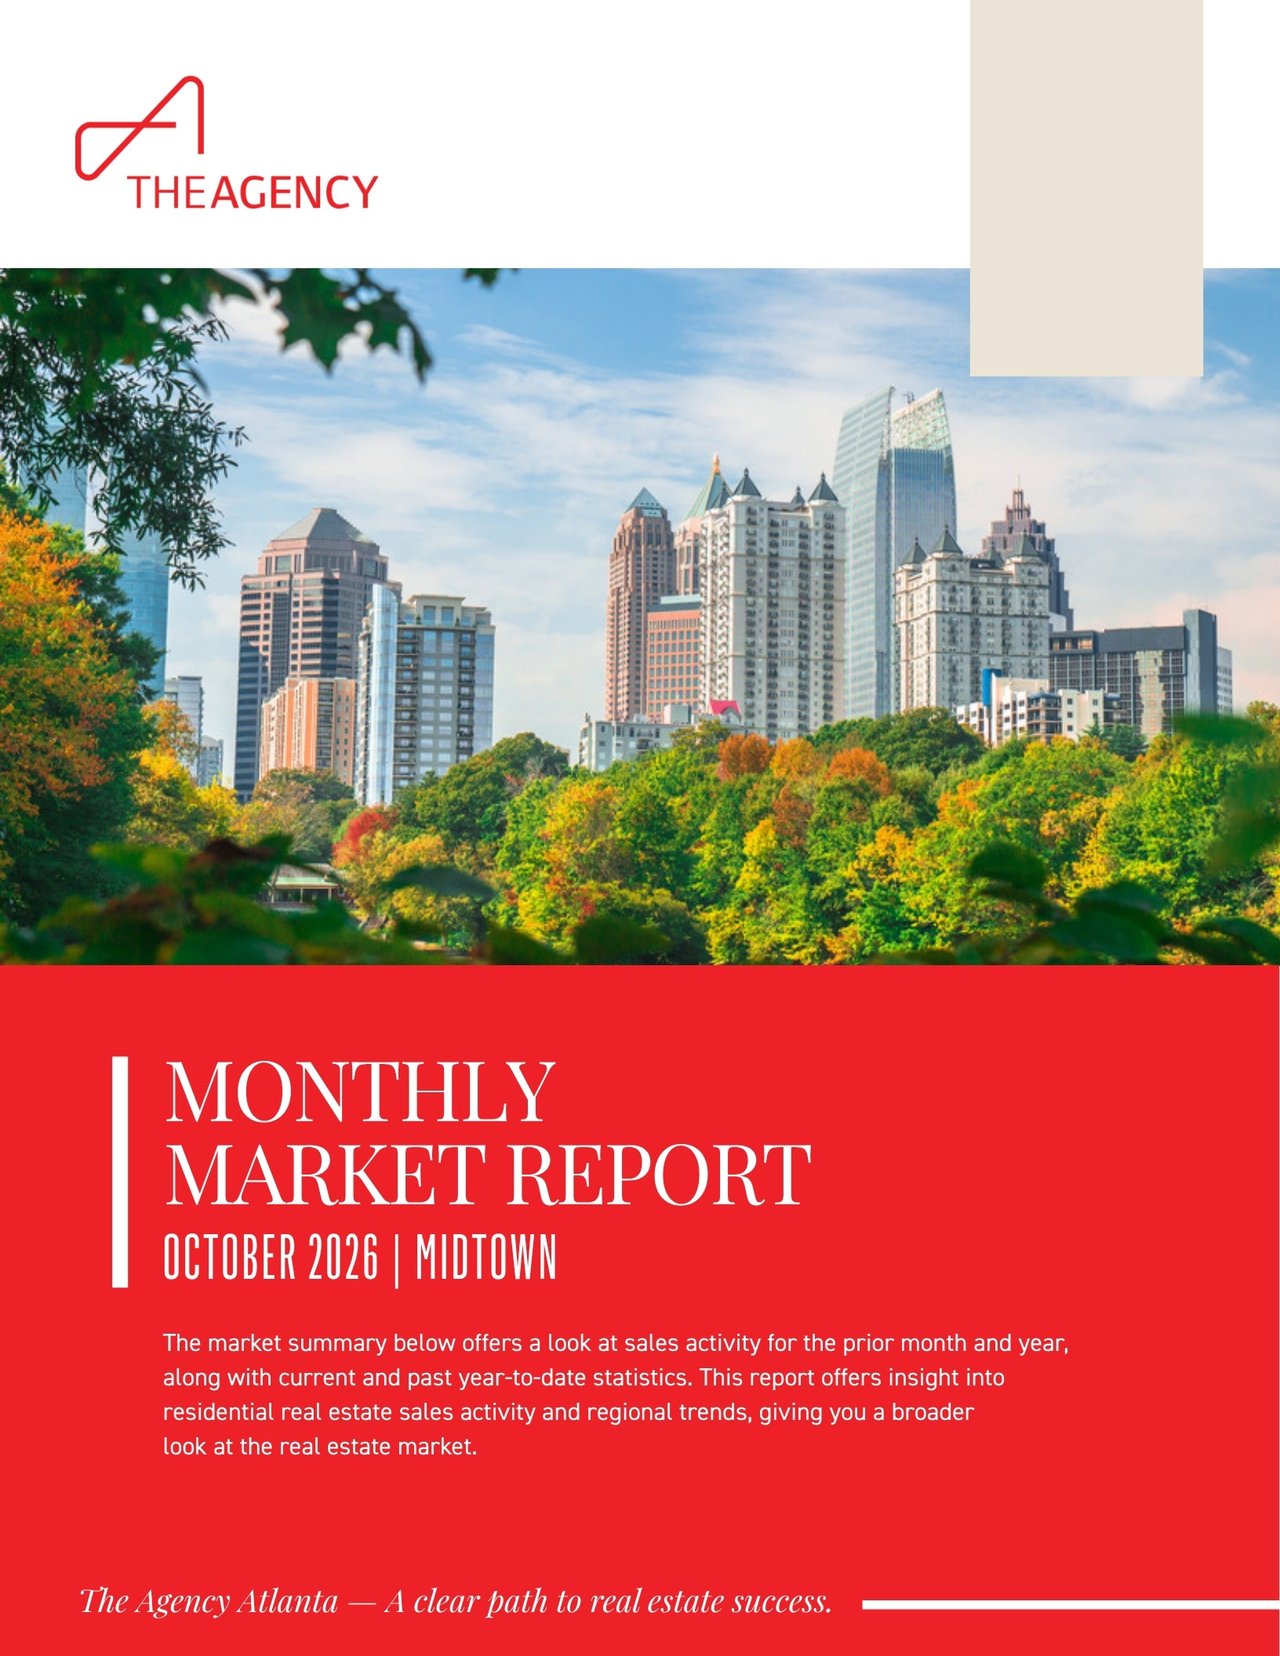
A ZIP code look at single family homes and condos in 30308 and 30309.
Condo sales in ZIP code 30309 fell 47.5% in October 2026 compared with October 2025, from 40 closings to 21, while single family sales in the same ZIP code rose 100%, from 4 to 8 (FMLS, October 2026). That split sets the tone for the Midtown real estate market October 2026: two ZIP codes, two property types, and four distinct stories. This report covers single family homes and condos in 30308 and 30309, using FMLS data for October 2026 and year to date activity from January through October 2026 compared with the same period of 2025. Each section opens with the short answer, then adds the detail buyers and sellers ask about most. For the previous month, read the Midtown real estate market report for September 2026.
What Is Happening in the Midtown Real Estate Market October 2026?
October 2026 was uneven across Midtown. Closed sales rose in three of the four segments, and the median sold price was lower than October 2025 in all four (FMLS, October 2026). Single family homes in 30309 sold at a median of $2,156,250 after a median of 9 days on market, while 30309 condos closed at a median of $279,000 after 68 days.
About the Midtown Market
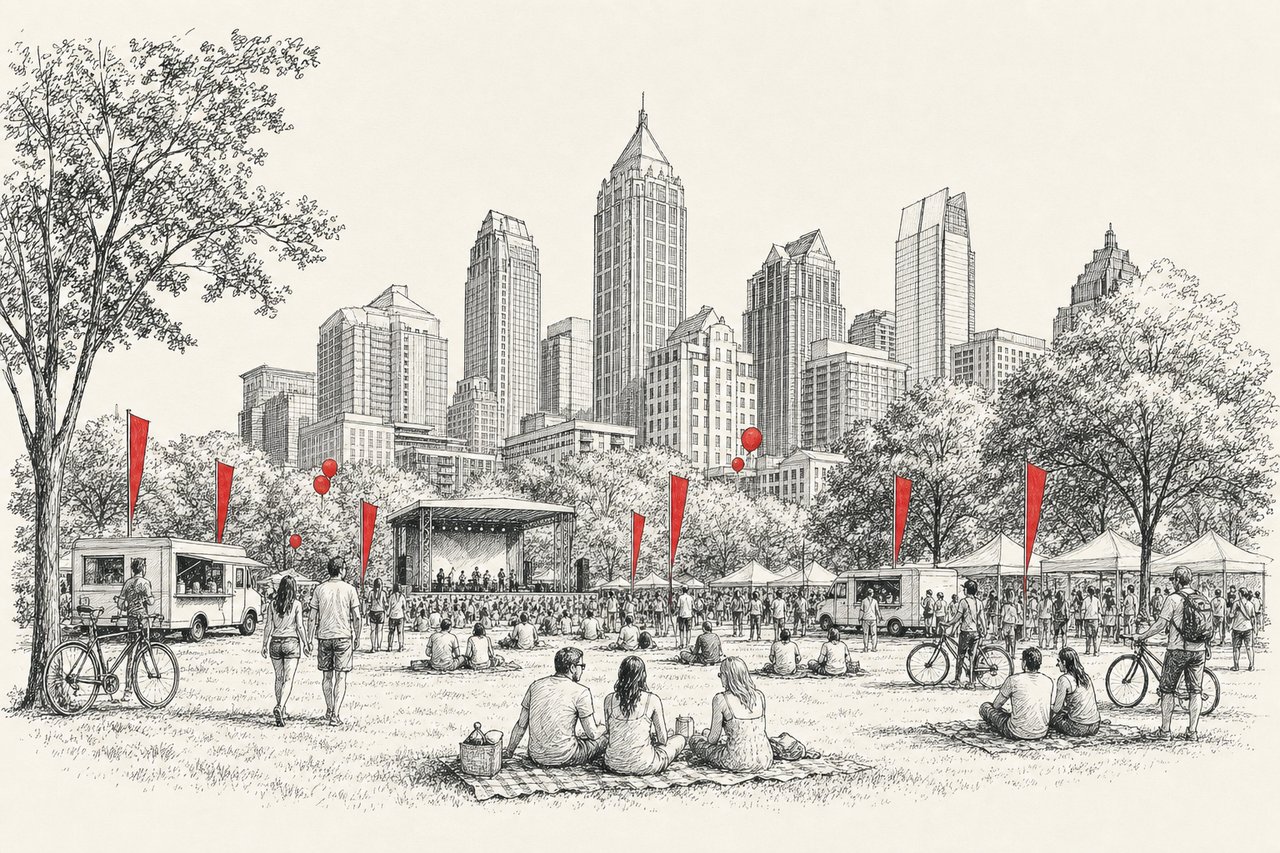
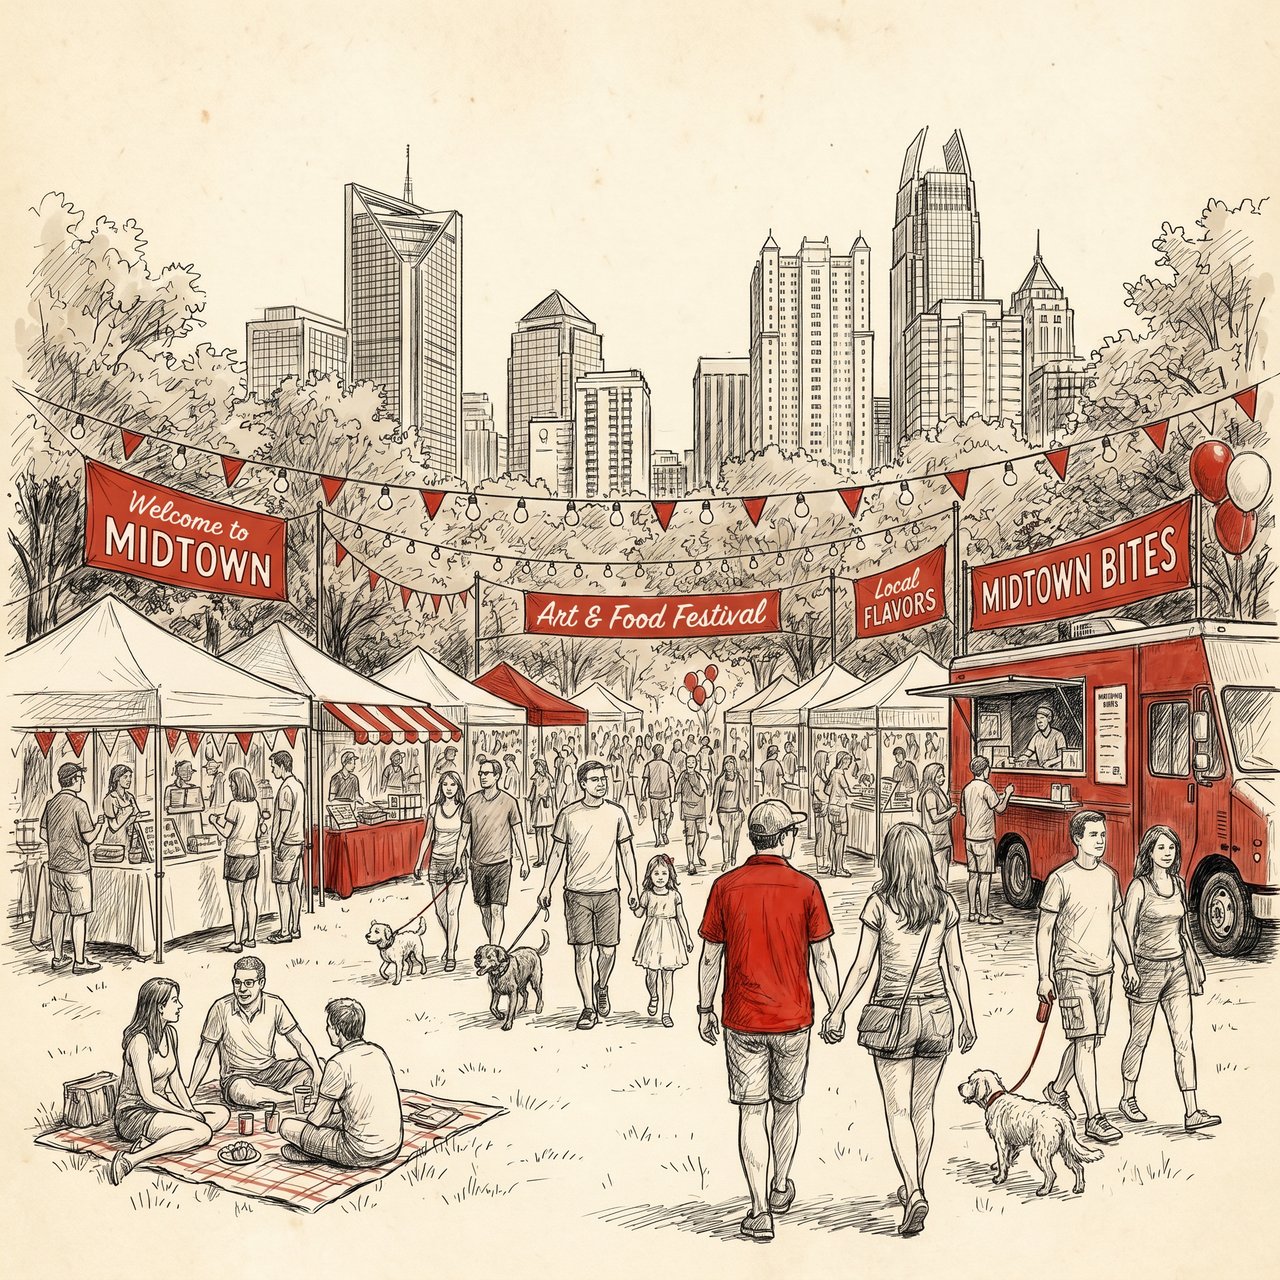
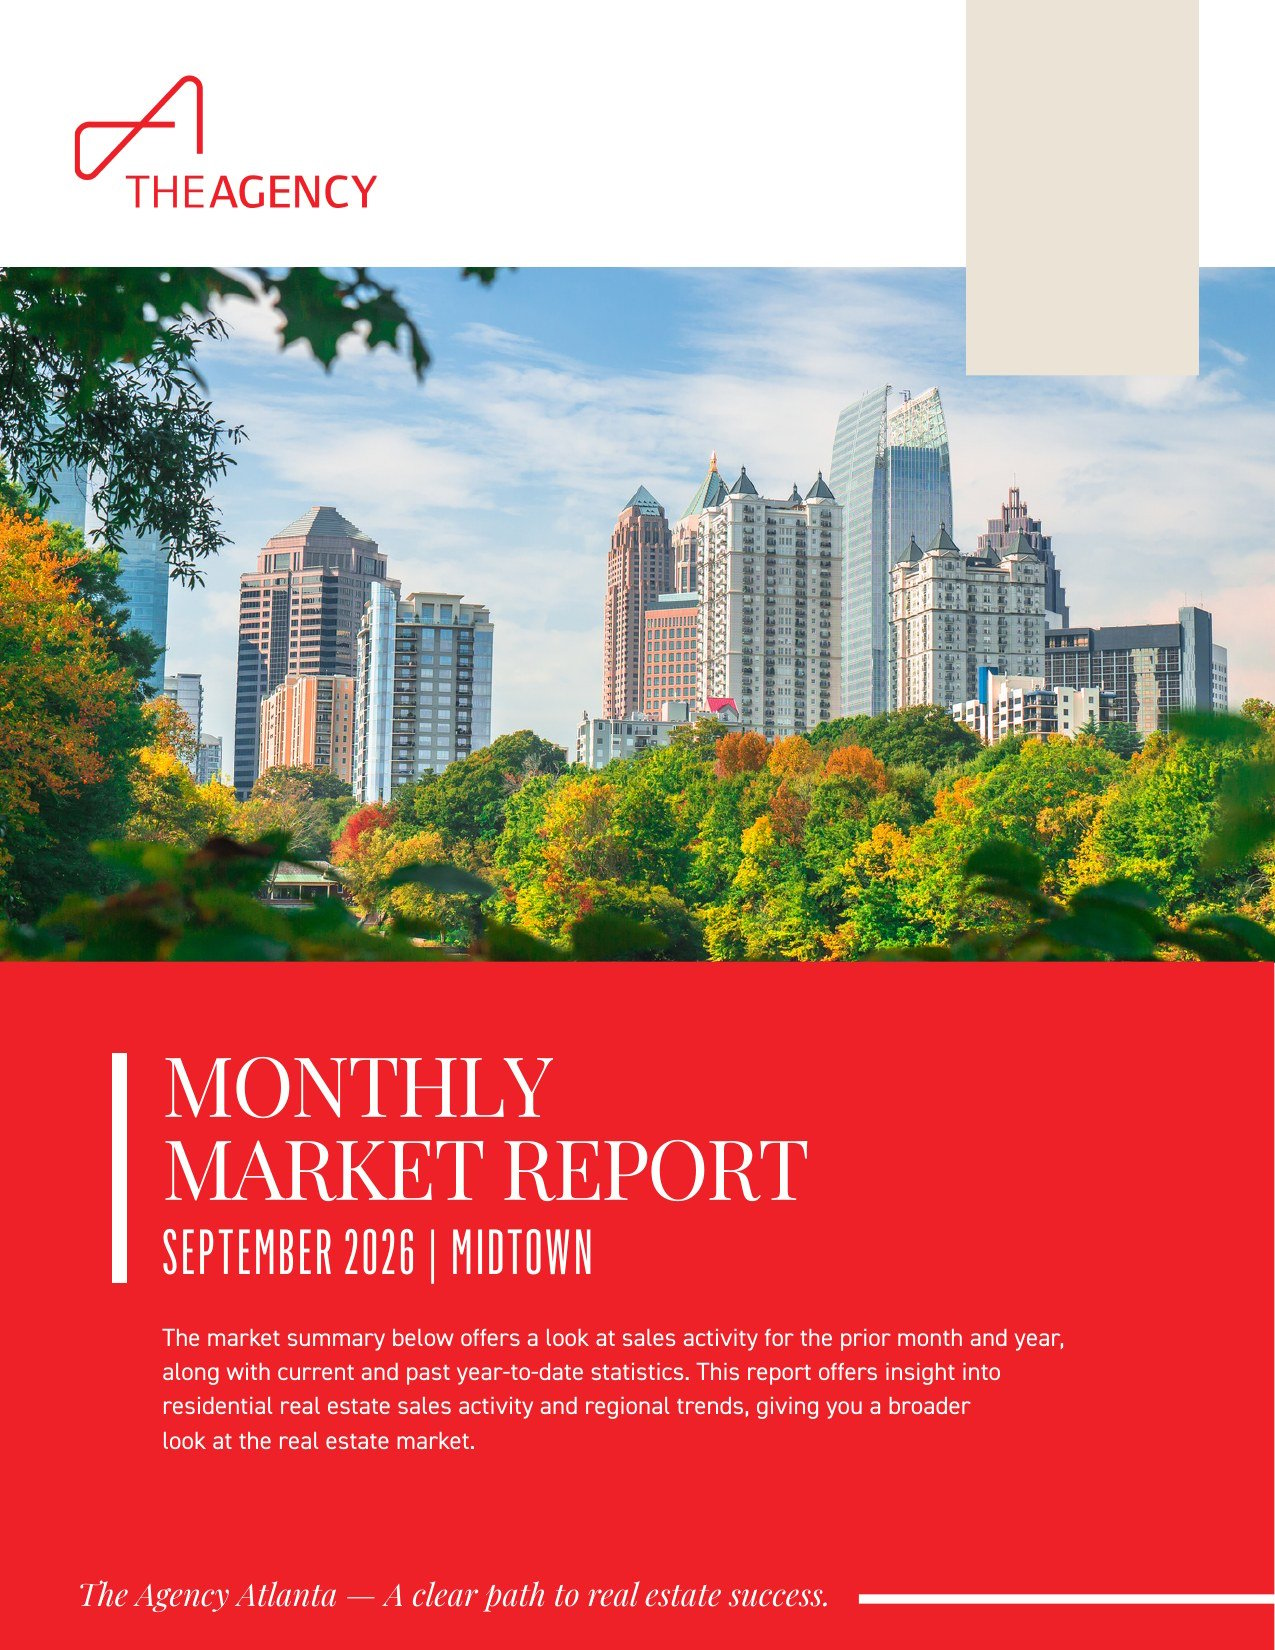
Midtown runs along the Peachtree Street corridor, home to the Woodruff Arts Center, the High Museum of Art and the Fox Theatre, and it borders Piedmont Park and the Atlanta Botanical Garden. The Downtown Connector (I-75/85) and MARTA's Midtown and Arts Center stations provide the main access routes. Established single family streets in Ansley Park and Sherwood Forest sit alongside high-rise condo buildings, which is why this report tracks both property types. To explore the area further, visit the Midtown neighborhood page.
Midtown Key Numbers by ZIP Code and Property Type
The tables below show six core measures for each segment: new listings, sold listings, median sold price, average sold price, median days on market and the list to sold price ratio. Each table compares October 2026 with October 2025 on the left and January through October 2026 with the same period of 2025 on the right.
30308 Single Family
Metric | October 2026 | October 2025 | Change | YTD 2026 | YTD 2025 | YTD Change |
|---|---|---|---|---|---|---|
New Listings | 1 | 5 | Down 80% | 54 | 63 | Down 14.29% |
Sold Listings | 3 | 1 | Up 200% | 32 | 22 | Up 45.45% |
Median Sold Price | $1,005,000 | $1,400,000 | Down 28.21% | $1,212,500 | $850,000 | Up 42.65% |
Average Sold Price | $853,333 | $1,400,000 | Down 39.05% | $1,184,193 | $932,040 | Up 27.05% |
Median Days on Market | 22 | 41 | Down 46.34% | 28 | 18 | Up 55.56% |
List/Sold Price Ratio | 94.7% | 93% | Up 1.8% | 102.5% | 97.1% | Up 5.57% |
Market data source: FMLS, October 2026. Figures reflect single family residential activity in ZIP code 30308.
30309 Single Family
Metric | October 2026 | October 2025 | Change | YTD 2026 | YTD 2025 | YTD Change |
|---|---|---|---|---|---|---|
New Listings | 16 | 17 | Down 5.88% | 139 | 138 | Up 0.72% |
Sold Listings | 8 | 4 | Up 100% | 70 | 69 | Up 1.45% |
Median Sold Price | $2,156,250 | $2,522,500 | Down 14.52% | $1,537,000 | $1,204,255 | Up 27.63% |
Average Sold Price | $2,127,592 | $2,582,250 | Down 17.61% | $1,840,673 | $1,490,969 | Up 23.45% |
Median Days on Market | 9 | 45 | Down 80% | 21 | 17 | Up 23.53% |
List/Sold Price Ratio | 99.5% | 98.8% | Up 0.76% | 98.4% | 98.1% | Up 0.29% |
Market data source: FMLS, October 2026. Figures reflect single family residential activity in ZIP code 30309.
30308 Condo
Metric | October 2026 | October 2025 | Change | YTD 2026 | YTD 2025 | YTD Change |
|---|---|---|---|---|---|---|
New Listings | 59 | 71 | Down 16.9% | 666 | 708 | Down 5.93% |
Sold Listings | 29 | 26 | Up 11.54% | 221 | 242 | Down 8.68% |
Median Sold Price | $325,000 | $330,450 | Down 1.65% | $344,000 | $335,950 | Up 2.4% |
Average Sold Price | $405,052 | $374,061 | Up 8.29% | $384,446 | $398,540 | Down 3.54% |
Median Days on Market | 76 | 54 | Up 40.74% | 53 | 48 | Up 10.42% |
List/Sold Price Ratio | 97.1% | 96.7% | Up 0.35% | 97% | 97% | Unchanged (0%) |
Market data source: FMLS, October 2026. Figures reflect condo residential activity in ZIP code 30308.
30309 Condo
Metric | October 2026 | October 2025 | Change | YTD 2026 | YTD 2025 | YTD Change |
|---|---|---|---|---|---|---|
New Listings | 79 | 86 | Down 8.14% | 906 | 975 | Down 7.08% |
Sold Listings | 21 | 40 | Down 47.5% | 379 | 422 | Down 10.19% |
Median Sold Price | $279,000 | $342,500 | Down 18.54% | $353,500 | $358,000 | Down 1.26% |
Average Sold Price | $375,661 | $400,896 | Down 6.29% | $474,552 | $448,276 | Up 5.86% |
Median Days on Market | 68 | 60 | Up 13.33% | 47 | 43 | Up 9.3% |
List/Sold Price Ratio | 96.5% | 96.7% | Down 0.19% | 96.8% | 97.6% | Down 0.82% |
Market data source: FMLS, October 2026. Figures reflect condo residential activity in ZIP code 30309.
How Are Midtown Single Family Homes Performing?
Single family activity in Midtown is small in volume and large in price. Sold listings rose in both ZIP codes in October 2026, but median sold prices were lower than October 2025 in each, and homes sold faster in both. Year to date, median sold prices are above 2025 in both ZIP codes (FMLS, October 2026).
30308 Single Family
New listings were 1 in October 2026 against 5 in October 2025, and sold listings were 3 against 1. With only three sales, one closing can move the median. The median sold price was $1,005,000, down 28.21%, and the median days on market were 22, down 46.34%. Year to date, 32 homes sold against 22, up 45.45%, at a median sold price of $1,212,500, up 42.65%.
30309 Single Family
New listings were 16 in October 2026 against 17, down 5.88%. Sold listings rose 100%, from 4 to 8. The median sold price was $2,156,250, down 14.52%, and the median days on market fell from 45 to 9. The list to sold price ratio was 99.5% against 98.8%. Year to date, 70 homes sold against 69, up 1.45%, and the median sold price was $1,537,000, up 27.63%.
How Are Midtown Condos Performing?
Midtown condos moved on a longer timeline than single family homes in October 2026. Median days on market were 76 in 30308 and 68 in 30309, and median sold prices were lower than a year earlier in both ZIP codes. Year to date, sales volume is lower in both ZIP codes, while median sold prices sit close to 2025 levels (FMLS, October 2026).
30308 Condo
Sold listings rose 11.54%, from 26 to 29, while new listings fell 16.9%, from 71 to 59. The median sold price was $325,000, down 1.65%. Median days on market rose from 54 to 76. Year to date, 221 condos sold against 242, down 8.68%, at a median sold price of $344,000, up 2.4%.
30309 Condo
Sold listings fell 47.5%, from 40 to 21, and new listings fell 8.14%, from 86 to 79. The median sold price was $279,000, down 18.54%, and median days on market were 68 against 60. Year to date, 379 condos sold against 422, down 10.19%, at a median sold price of $353,500, down 1.26%.
What Do These Numbers Mean for Buyers and Sellers?
Buyers and sellers in Midtown are reading different markets depending on the property type. Single family homes in 30309 closed quickly and near list price in October 2026, while condos took longer and closed further below list. The figures below describe the conditions each side is working in, not a forecast.
What It Means for Buyers
- Condo buyers saw median days on market of 76 in 30308 and 68 in 30309 in October 2026, which allows more time to review a property and compare options.
- List to sold price ratios of 97.1% in 30308 and 96.5% in 30309 show condos closing below list price on that measure in October 2026.
- Single family buyers in 30309 faced a median of 9 days on market and a 99.5% ratio, so preparation before touring matters.
What It Means for Sellers
- Single family sellers in 30309 benefited from a median of 9 days on market and a 99.5% ratio in October 2026.
- Year to date, single family median sold prices were $1,212,500 in 30308 and $1,537,000 in 30309, both above the same period of 2025.
- Condo sellers faced longer marketing times, with 30308 at 76 median days and 30309 at 68 in October 2026. Pricing close to recent closed sales is the clearest lever the data supports.
What Do the Trends Suggest for the Months Ahead?
This is a reading of the trend, not a forecast. Single family prices are elevated year to date, and condo volume is lower year to date in both ZIP codes. October 2026 showed single family sales picking up in count, while condo timelines lengthened. The next monthly reports will show if these patterns hold or shift.
Single Family and Condos
Year to date single family median sold prices are above 2025 in both ZIP codes, even though October medians were lower. With sale counts this small, the year to date figures are the more stable guide. For condos, year to date new listings are down in both ZIP codes (down 5.93% in 30308 and down 7.08% in 30309), and sold listings are down as well. Year to date median days on market are 53 in 30308 against 48, and 47 in 30309 against 43. Fewer listings, fewer sales and longer marketing times together read as a measured pace rather than a fast one.
Midtown Real Estate FAQ
These answers draw on the FMLS figures for October 2026 and for January through October 2026 shown in the tables above. Each answer names the ZIP code and property type so that the numbers can be compared accurately across Midtown.
What is the median sold price for Midtown condos in October 2026?
The median sold price was $325,000 in 30308 and $279,000 in 30309 (FMLS, October 2026). Compared with October 2025, that is down 1.65% in 30308 and down 18.54% in 30309. Year to date, the median sold price is $344,000 in 30308, up 2.4%, and $353,500 in 30309, down 1.26%. Condo medians reflect the buildings and unit sizes that closed in a given month, so the year to date figures are usually the better comparison.
How quickly are Midtown single family homes selling?
In 30309, the median days on market were 9 in October 2026 against 45 in October 2025. In 30308, the median was 22 against 41, based on 3 sales. Year to date, the median days on market are 21 in 30309 and 28 in 30308, compared with 17 and 18 in the same period of 2025 (FMLS, October 2026).
Are there more homes for sale in Midtown than last year?
New listings were lower than October 2025 in all four segments: 1 against 5 for 30308 single family, 16 against 17 for 30309 single family, 59 against 71 for 30308 condos and 79 against 86 for 30309 condos. Year to date, new listings are also lower in three segments, and 30309 single family is up 0.72%, from 138 to 139 (FMLS, October 2026).
What is the list to sold price ratio in Midtown?
The ratio compares closed prices with list prices. In October 2026 it was 94.7% for 30308 single family, 99.5% for 30309 single family, 97.1% for 30308 condos and 96.5% for 30309 condos. Year to date, the ratios were 102.5%, 98.4%, 97% and 96.8% in the same order. More market context is available from the Georgia Association of REALTORS.
Midtown Real Estate Market October 2026: Key Takeaways
Three points stand out in the Midtown real estate market October 2026. Single family sales rose in both ZIP codes, with 30309 homes selling after a median of 9 days. Condo activity was mixed, with sold listings up 11.54% in 30308 and down 47.5% in 30309. Year to date single family median sold prices remain above 2025. To review a specific home or condo against recent closed sales, contact The Agency Atlanta to schedule a consultation.