Single family homes sold faster at a steady price while condos took longer.
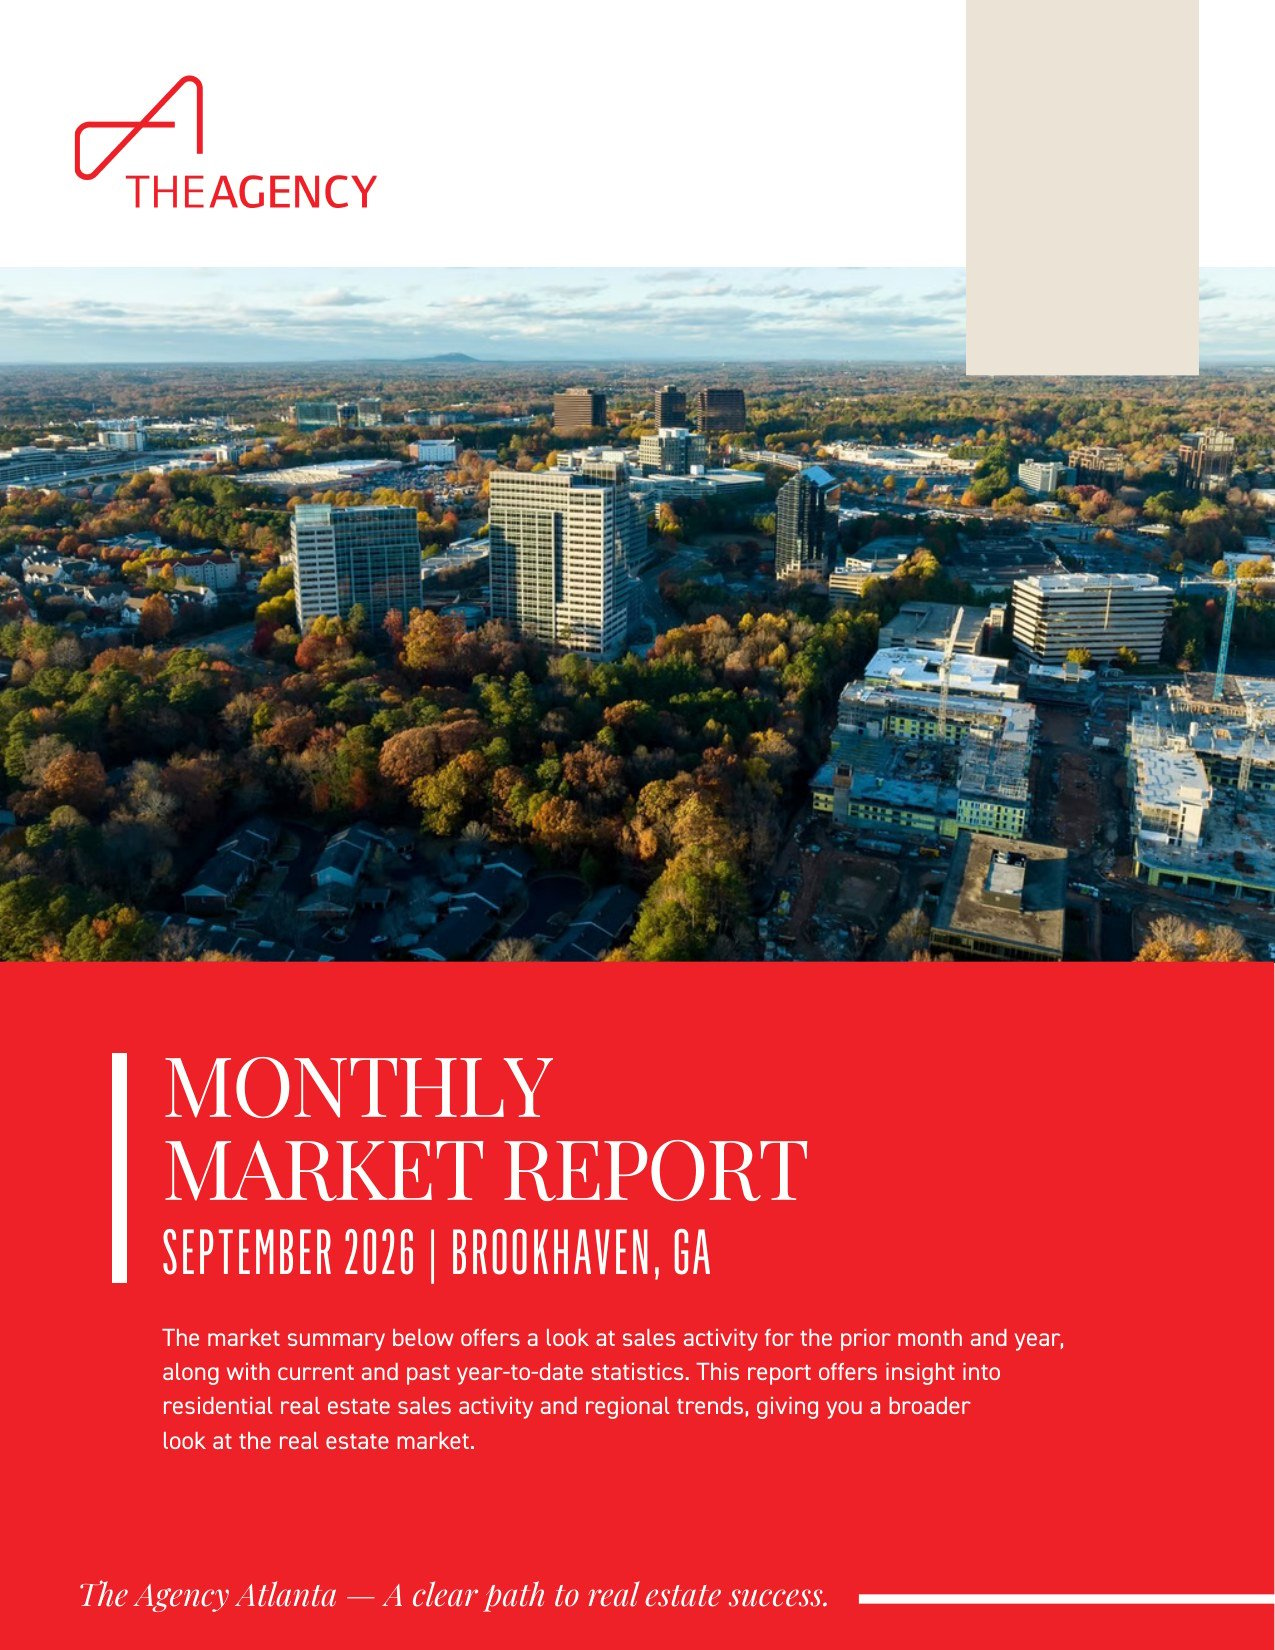
Brookhaven recorded 39 new single family listings in October 2026, up 21.88% from October 2025, while closed sales fell to 10 from 19 (FMLS, October 2026). That gap between fresh supply and completed sales shapes this Brookhaven real estate market October 2026 report. Below are single family and condo results for the month and for January through October, and what they suggest for buyers and sellers. Brookhaven includes areas such as Ashford Park, Lenox Park and the streets around Town Brookhaven, and conditions can differ from one block to the next, so treat these as citywide measures. For last month's figures, see the September 2026 Brookhaven report.
What Does the Brookhaven Real Estate Market October 2026 Report Show?
Brookhaven single family homes closed 10 sales in October 2026 at a median sold price of $952,500, with a median of 13 days on market. Condos closed 5 sales at a median sold price of $457,000 and a median of 60 days on market. Both segments are small for a single month, so year to date figures add useful context (FMLS, October 2026).
Single Family Homes: October 2026 and Year to Date
The table compares October 2026 with October 2025, and January through October 2026 (YTD 2026) with the same months of 2025 (YTD 2025).
Metric | October 2026 | October 2025 | Change | YTD 2026 | YTD 2025 | YTD Change |
|---|---|---|---|---|---|---|
New Listings | 39 | 32 | Up 21.88% | 346 | 452 | Down 23.45% |
Sold Listings | 10 | 19 | Down 47.37% | 199 | 243 | Down 18.11% |
Median List Price (Solds) | $967,500 | $995,000 | Down 2.76% | $975,000 | $975,000 | Unchanged (0%) |
Median Sold Price | $952,500 | $953,000 | Down 0.05% | $980,000 | $953,000 | Up 2.83% |
Median Days on Market | 13 | 56 | Down 76.79% | 13 | 17 | Down 23.53% |
Average List Price (Solds) | $1,212,500 | $1,303,310 | Down 6.97% | $1,210,620 | $1,182,778 | Up 2.35% |
Average Sold Price | $1,192,050 | $1,273,421 | Down 6.39% | $1,197,302 | $1,162,410 | Up 3% |
Average Days on Market | 16 | 53 | Down 69.81% | 28 | 34 | Down 17.65% |
List/Sold Price Ratio | 99% | 97.3% | Up 1.73% | 99.2% | 98.5% | Up 0.68% |
Market data source: FMLS, October 2026. Figures reflect single family residential activity in Brookhaven.
Condos: October 2026 and Year to Date
Metric | October 2026 | October 2025 | Change | YTD 2026 | YTD 2025 | YTD Change |
|---|---|---|---|---|---|---|
New Listings | 25 | 26 | Down 3.85% | 231 | 245 | Down 5.71% |
Sold Listings | 5 | 11 | Down 54.55% | 87 | 129 | Down 32.56% |
Median List Price (Solds) | $449,900 | $625,000 | Down 28.02% | $660,000 | $505,000 | Up 30.69% |
Median Sold Price | $457,000 | $615,000 | Down 25.69% | $650,000 | $505,000 | Up 28.71% |
Median Days on Market | 60 | 31 | Up 93.55% | 43 | 33 | Up 30.3% |
Average List Price (Solds) | $495,084 | $581,704 | Down 14.89% | $627,046 | $534,817 | Up 17.24% |
Average Sold Price | $491,132 | $571,631 | Down 14.08% | $614,862 | $527,183 | Up 16.63% |
Average Days on Market | 67 | 50 | Up 34% | 61 | 54 | Up 12.96% |
List/Sold Price Ratio | 99.4% | 98% | Up 1.43% | 97.9% | 98.4% | Down 0.57% |
Market data source: FMLS, October 2026. Figures reflect condo residential activity in Brookhaven.
How Are Brookhaven Single Family Homes Selling?
Brookhaven single family homes sold faster in October 2026 even as the number of closings dropped. The median time on market was 13 days, compared with 56 days in October 2025, and the list to sold price ratio reached 99%. Ten homes closed, down 47.37% from 19 a year earlier (FMLS, October 2026).
Pace and Activity
New listings rose to 39 from 32, an increase of 21.88%. The average days on market fell to 16 from 53, a drop of 69.81%. Year to date, the median days on market is 13 compared with 17, and the average is 28 compared with 34.
Year to date new listings total 346 compared with 452, down 23.45%, and sold listings total 199 compared with 243, down 18.11%.
Pricing
The median sold price was $952,500 compared with $953,000 a year earlier, down 0.05%, which is essentially level. The median list price of sold homes was $967,500, down 2.76% from $995,000. The average sold price was $1,192,050, down 6.39% from $1,273,421.
Year to date the picture is steadier to higher. The median sold price is $980,000 compared with $953,000, up 2.83%, and the average sold price is $1,197,302 compared with $1,162,410, up 3%. With only 10 closings in October, the monthly average reflects the specific homes that sold.
How Is the Brookhaven Condo Market Moving?
Brookhaven condos took longer to sell in October 2026. The median time on market was 60 days, up 93.55% from 31 days a year earlier, and 5 sales closed compared with 11. The median sold price was $457,000, down 25.69% from $615,000 (FMLS, October 2026).
October 2026 Results
New condo listings were 25 compared with 26, down 3.85%, so supply entering the market held close to last year's level. The average days on market rose to 67 from 50, up 34%. The average sold price was $491,132, down 14.08% from $571,631. The list to sold price ratio was 99.4% compared with 98%, up 1.43%, which shows that the units that did sell closed very near their list prices.
Five closings is a small sample. A change in which units sold, such as their size, building or floor, can move medians sharply from one month to the next.
Year to Date Results
The longer record sits well above October. The year to date median sold price is $650,000 compared with $505,000, up 28.71%, and the average sold price is $614,862 compared with $527,183, up 16.63%. Sold listings total 87 compared with 129, down 32.56%, and new listings total 231 compared with 245, down 5.71%.
Time on market has lengthened as well. The year to date median is 43 days compared with 33, and the average is 61 days compared with 54. The year to date ratio is 97.9% compared with 98.4%, down 0.57%.
What Do the Brookhaven Numbers Mean for Buyers?
Buyers of single family homes in Brookhaven faced quick timelines in October 2026, with a median of 13 days on market and a list to sold price ratio of 99%. Condo buyers saw a different pace, with a median of 60 days on market and a ratio of 99.4% (FMLS, October 2026).
Single Family Buyers
Homes that were priced in line with the market did not wait long. A 99% ratio means final prices landed very close to list prices, so there was little gap to negotiate on homes that drew attention. The month's 39 new listings gave buyers more to choose from than the 32 listed in October 2025, which helps when comparing options across Ashford Park, Lenox Park and other parts of the city.
Condo Buyers
The longer median of 60 days gives condo buyers more time to compare units, read association documents and tour more than once. Location often drives the decision. Some buyers focus on the area near Town Brookhaven and the Peachtree Road corridor, while others look closer to the MARTA Brookhaven/Oglethorpe station or along Buford Highway. The neighborhoods page is a useful place to compare these areas before touring.
What Do the Brookhaven Numbers Mean for Sellers?
Sellers of single family homes in Brookhaven saw a median of 13 days on market in October 2026 and a 99% list to sold price ratio, which points to solid results for homes priced in line with the market. Condo sellers worked with a median of 60 days and should plan for a longer timeline (FMLS, October 2026).
Single Family Sellers
The average list price of sold homes was $1,212,500 and the average sold price was $1,192,050, a gap that the 99% ratio reflects. Year to date the ratio is 99.2% compared with 98.5%. With only 10 sales in the month, comparable closings are limited, so a market analysis from a local agent that weighs the specific street, lot and condition of the home adds detail the citywide figures cannot.
Condo Sellers
Condo sellers saw a 99.4% ratio in October, so accepted offers landed close to list price, but they took longer to arrive. The year to date ratio is 97.9%. Accurate pricing from the first day, careful presentation and clear information about the building help a listing stand out during a longer marketing period.
Reading the Brookhaven Trend: What the Data Suggests
The October 2026 figures show Brookhaven single family homes selling quickly with fewer closings, and condos taking longer with fewer closings. This is a reading of recent data, not a forecast. Following the same measures month to month is the most reliable way to see if these patterns hold (FMLS, October 2026).
Signals to Watch
- New listings compared with sales: single family new listings rose 21.88% in October while sold listings fell 47.37%. If listings keep outpacing closings, available inventory grows. If closings catch up, inventory tightens.
- Days on market: the single family median of 13 days is the same as the year to date median, while the condo median of 60 days is above the year to date median of 43.
Limits of the Data
One month of data, especially one with 10 single family sales and 5 condo sales, can shift sharply with a few closings. The year to date figures smooth that out, and the figures here describe all of Brookhaven, not any one street or building.
Brookhaven Real Estate Market FAQ
What was the median sold price in Brookhaven in October 2026?
The single family median sold price was $952,500, compared with $953,000 in October 2025, a change of 0.05% down. The condo median sold price was $457,000, compared with $615,000, down 25.69%. Year to date, the single family median is $980,000, up 2.83%, and the condo median is $650,000, up 28.71% (FMLS, October 2026).
How long did homes take to sell in Brookhaven in October 2026?
Single family homes had a median of 13 days on market, compared with 56 days a year earlier, and an average of 16 days compared with 53. Condos had a median of 60 days compared with 31, and an average of 67 days compared with 50. Year to date, the single family median is 13 days compared with 17, and the condo median is 43 days compared with 33 (FMLS, October 2026).
How many homes sold in Brookhaven in October 2026?
There were 10 single family sales, compared with 19 in October 2025, down 47.37%, and 5 condo sales, compared with 11, down 54.55%. Year to date there have been 199 single family sales compared with 243, and 87 condo sales compared with 129. New listings in October were 39 for single family homes and 25 for condos (FMLS, October 2026).
Do Brookhaven homes sell close to the list price?
In October 2026 the list to sold price ratio was 99% for single family homes, compared with 97.3% a year earlier, and 99.4% for condos, compared with 98%. Year to date the ratio is 99.2% for single family homes and 97.9% for condos. Individual homes vary with price, condition and timing (FMLS, October 2026).
Where does this Brookhaven market data come from?
The figures come from FMLS, the Georgia multiple listing service, for October 2026, and they cover closed sales and new listings reported in the city. Month to date figures compare October 2026 with October 2025, and year to date figures compare January through October 2026 with the same months of 2025. You can learn more at FMLS and at the Georgia Association of Realtors.
Brookhaven Real Estate Market Takeaways
Three points stand out from October 2026. Single family homes sold quickly, with a median of 13 days on market and a 99% list to sold price ratio, although closings fell to 10. Condos took longer, with a median of 60 days, and the median sold price was $457,000. Year to date, both segments show higher median sold prices than the same months of 2025, at $980,000 for single family homes and $650,000 for condos. To talk through what these figures mean for your own plans, contact The Agency Atlanta to schedule a consultation.