Atlanta single family homes: October 2026 results and year to date trends
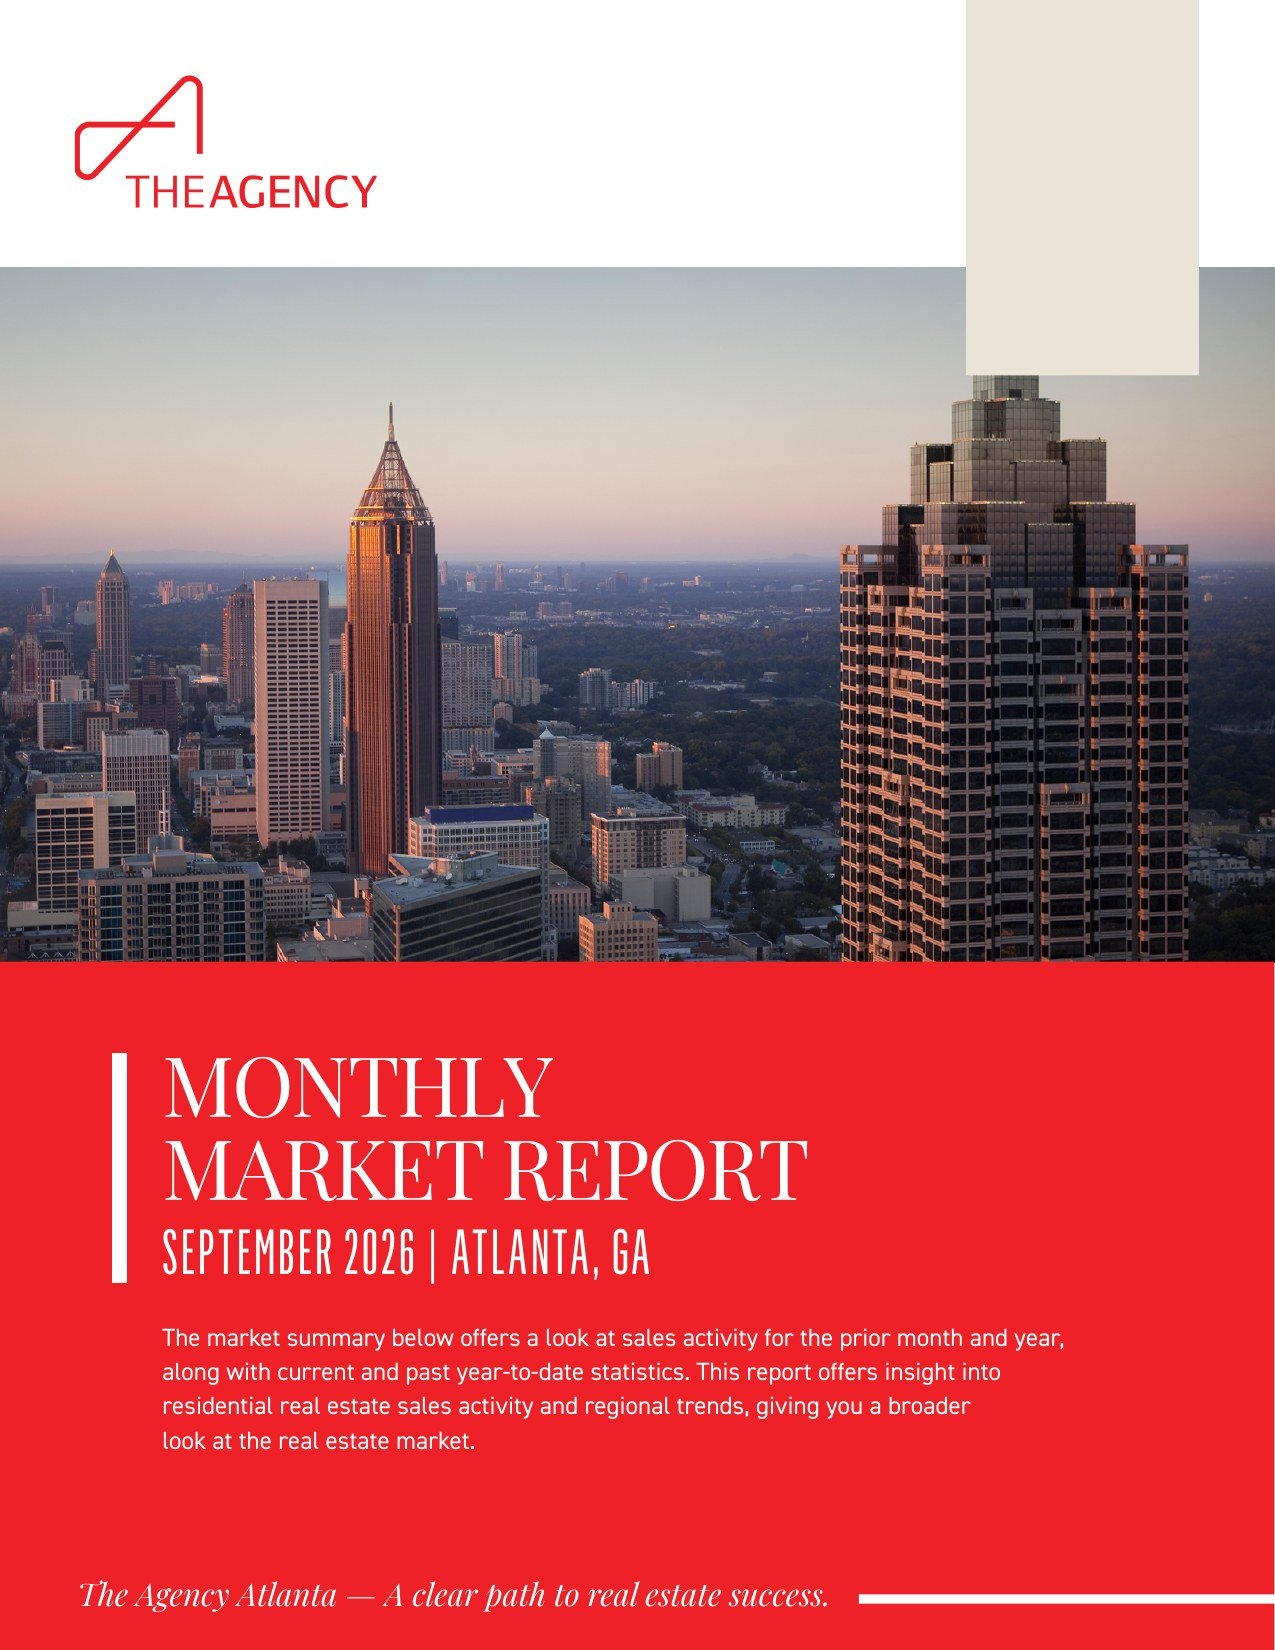
Atlanta's median single family sold price was $440,000 in October 2026, down 8.9% from a year earlier (FMLS, October 2026). The Atlanta real estate market October 2026 report also shows 898 new listings and 398 sold listings, both below October 2025, while median days on market held at 30. This report covers single family homes in the city of Atlanta, using FMLS data for October 2026 and for January through October 2026 compared with the same months of 2025. It sets out the key numbers, what they show for buyers and sellers, and how to read the trend. For the previous month, see the Atlanta real estate market report for September 2026.
How Did the Atlanta Housing Market Perform in October 2026?
Atlanta single family activity was lower in October 2026 than in October 2025. New listings were 898 compared with 1,124, and sold listings were 398 compared with 549. The median sold price was $440,000 compared with $483,000, and median days on market was 30 in both months. The table below lists every October measure from FMLS.
Metric | October 2026 | October 2025 | % Change |
|---|---|---|---|
New Listings | 898 | 1,124 | -20.11% |
Sold Listings | 398 | 549 | -27.5% |
Median List Price (Solds) | $450,000 | $495,978 | -9.27% |
Median Sold Price | $440,000 | $483,000 | -8.9% |
Median Days on Market | 30 | 30 | 0% |
Average List Price (Solds) | $732,008 | $752,423 | -2.71% |
Average Sold Price | $712,988 | $731,729 | -2.56% |
Average Days on Market | 47 | 55 | -14.55% |
List/Sold Price Ratio | 97.3% | 97.5% | -0.19% |
Market data source: FMLS, October 2026. Figures reflect single family residential activity in Atlanta.
New and Sold Listings
New listings were 898 in October 2026, compared with 1,124 in October 2025, a change of -20.11%. Sold listings were 398, compared with 549, a change of -27.5%. The list/sold price ratio was 97.3%, compared with 97.5% a year earlier, a change of -0.19%.
How Did Atlanta Prices and Pace Change in October 2026?
The median sold price was $440,000, down 8.9% from $483,000, and the average sold price was $712,988, down 2.56% from $731,729. Median days on market was 30 in both years, while average days on market was 47 compared with 55. Prices were lower than a year earlier and the typical time to sell was unchanged.
Median Prices
The median list price of homes that sold was $450,000, compared with $495,978 in October 2025, a change of -9.27%. The median sold price was $440,000, compared with $483,000, a change of -8.9%. The median is the middle sale of the month, so it describes a typical closing.
Average Prices
The average list price of sold homes was $732,008, compared with $752,423, a change of -2.71%. The average sold price was $712,988, compared with $731,729, a change of -2.56%. The average sits above the median because higher priced closings raise it.
Days on Market
Median days on market was 30 in October 2026 and 30 in October 2025. Average days on market was 47, compared with 55, a change of -14.55%. The average of 47 days sits above the median of 30 days.
What Does Year to Date 2026 Show for Atlanta?
Year to date, January through October 2026, Atlanta single family prices are higher than in the same months of 2025 while listing and sales counts are lower. The median sold price is $535,000, up 7% from $500,000, and sold listings are 5,022, compared with 5,492. New listings are 10,271, compared with 11,756.
Metric | YTD 2026 | YTD 2025 | % Change |
|---|---|---|---|
New Listings | 10,271 | 11,756 | -12.63% |
Sold Listings | 5,022 | 5,492 | -8.56% |
Median List Price (Solds) | $547,250 | $500,000 | 9.45% |
Median Sold Price | $535,000 | $500,000 | 7% |
Median Days on Market | 25 | 27 | -7.41% |
Average List Price (Solds) | $784,030 | $722,024 | 8.59% |
Average Sold Price | $770,080 | $706,756 | 8.96% |
Average Days on Market | 49 | 48 | 2.08% |
List/Sold Price Ratio | 98.1% | 98% | 0.14% |
Market data source: FMLS, October 2026. Figures reflect single family residential activity in Atlanta.
Prices Year to Date
The median sold price year to date was $535,000, up 7% from $500,000. The average sold price was $770,080, up 8.96% from $706,756. In October alone, both measures were lower than in October 2025, so the month and the year show different price directions.
Activity and Pace Year to Date
New listings year to date changed by -12.63%, and sold listings changed by -8.56%. Median days on market was 25, compared with 27, a change of -7.41%. Average days on market was 49, compared with 48, a change of 2.08%. The list/sold price ratio was 98.1%, compared with 98%.
What Do the Numbers Mean for Atlanta Buyers?
Buyers saw 898 new single family listings in October 2026, fewer than the 1,124 of October 2025. The median sold price of $440,000 was below last October's $483,000, and homes closed at a list/sold price ratio of 97.3%. Year to date, the median sold price is $535,000, so the month and the year give different reference points.
Using the Data in a Search
Average days on market was 47 in October, compared with 55 a year earlier, and median days on market was 30. Median days on market was the same as last year. Buyers can review new listings as they appear and compare each home with recent nearby sales, because citywide figures blend many different neighborhoods and price points.
What Do the Numbers Mean for Atlanta Sellers?
Sellers closed 398 single family sales in October 2026, compared with 549 in October 2025. Homes that sold did so at 97.3% on the list/sold price ratio, close to the 97.5% of last year. The median list price of sold homes was $450,000, and the median sold price was $440,000. Those figures show how closed sales related to asking prices in the month.
Using the Data in a Listing Plan
Year to date, the list/sold price ratio is 98.1%, and median days on market is 25. A listing plan is stronger when it rests on recent sales of similar homes nearby, since Atlanta neighborhoods differ in housing stock and pace. An agent can pull those comparable sales for a specific address and review them with the owner.
How Should You Read the Atlanta Trend?
The trend reading is straightforward: October counts and prices were below October 2025, while year to date prices are above 2025 and year to date counts are below. This is analysis of reported data and not a forecast. Reading the monthly and year to date figures together gives a fuller view than either alone.
What the Data Shows
New listings are lower in October (-20.11%) and year to date (-12.63%). Sold listings are lower in October (-27.5%) and year to date (-8.56%). Median sold price is lower in October (-8.9%) and higher year to date (7%). Median days on market is unchanged in October at 30 and lower year to date at 25.
Neighborhood Level Detail
Citywide figures combine many areas, including Buckhead, Midtown, Old Fourth Ward, Grant Park, Kirkwood, Ansley Park and Morningside. The Atlanta neighborhoods page offers a closer look at individual areas. Data in this report comes from FMLS, and more about the multiple listing service is available at FMLS. Statewide housing resources are available from Georgia REALTORS.
Frequently Asked Questions
The questions below answer common questions about Atlanta single family homes. Each answer uses FMLS data for October 2026 and for January through October 2026, compared with the same periods of 2025. The figures describe single family homes in the city of Atlanta only.
What was the median sold price for a single family home in Atlanta in October 2026?
The median sold price was $440,000 in October 2026, compared with $483,000 in October 2025, a change of -8.9%. The median list price of homes that sold was $450,000, compared with $495,978. Year to date, the median sold price is $535,000, compared with $500,000 for the same months of 2025 (FMLS, October 2026).
How many single family homes sold in Atlanta in October 2026?
There were 398 sold listings in October 2026, compared with 549 in October 2025, a change of -27.5%. New listings were 898, compared with 1,124, a change of -20.11%. Year to date, sold listings are 5,022, compared with 5,492 in the same months of 2025, and new listings are 10,271, compared with 11,756 (FMLS, October 2026).
How long did Atlanta homes take to sell in October 2026?
Median days on market was 30 in October 2026, the same as in October 2025. Average days on market was 47, compared with 55 a year earlier, a change of -14.55%. Year to date, median days on market is 25, compared with 27, and average days on market is 49, compared with 48 (FMLS, October 2026).
What was the list to sold price ratio in Atlanta in October 2026?
The list/sold price ratio was 97.3% in October 2026, compared with 97.5% in October 2025, a change of -0.19%. Year to date, the ratio is 98.1%, compared with 98% in the same months of 2025. The ratio compares the final sold price with the list price for homes that closed (FMLS, October 2026).
Does this report include condos or townhomes?
No. This report covers single family homes in the city of Atlanta only. Condominium and townhome sales are not part of the figures shown here, and the numbers should not be read as describing those property types. Other market reports from The Agency Atlanta cover different areas and, where noted, different property types, using the same FMLS source.
Final Thoughts on the Atlanta Market
October 2026 brought 898 new listings, 398 sold listings, a median sold price of $440,000 and a median of 30 days on market for Atlanta single family homes. Year to date, the median sold price is $535,000, up 7% from the same months of 2025. The month and the year together give the most complete view of the market.
To discuss how these figures apply to a specific home or neighborhood, contact The Agency Atlanta.