A data-driven look at Sandy Springs single-family sales, prices, and inventory for July 2026.
The Sandy Springs real estate market in July 2026 opened with a headline number that is hard to ignore: the median single-family sold price reached $1,382,500, up 31.17 percent from July 2025 (FMLS, July 2026). This report breaks down what happened across new listings, sold listings, pricing, and days on market for single-family homes in Sandy Springs, Georgia, and translates the figures into practical takeaways for buyers and sellers. Every statistic below comes directly from the July 2026 market report, and the analysis stays focused on the numbers rather than on predictions or guarantees. If you follow the Sandy Springs corridor along Roswell Road or the neighborhoods near the Chattahoochee River, this update gives you a clear, current picture.
What are the key numbers in the Sandy Springs real estate market July 2026?
In July 2026, Sandy Springs single-family homes posted a median sold price of $1,382,500, up 31.17 percent year over year, with 24 closed sales and 43 new listings (FMLS, July 2026). Median days on market rose to 29 from 13 a year earlier. The list to sold price ratio was 99.2 percent, showing homes still closed close to asking.
Month-to-date and year-to-date snapshot
The table below compares July 2026 with July 2025 and adds the year-to-date view. Figures are single-family only and reflect the values reported for the period.
Metric | July 2026 | July 2025 | % Change | YTD 2026 | YTD 2025 | % Change |
|---|---|---|---|---|---|---|
New Listings | 43 | 21 | +104.76% | 251 | 200 | +25.50% |
Sold Listings | 24 | 18 | +33.33% | 121 | 105 | +15.24% |
Median List Price (Solds) | $1,345,000 | $1,097,500 | +22.55% | $999,000 | $949,000 | +5.27% |
Median Sold Price | $1,382,500 | $1,054,000 | +31.17% | $1,040,000 | $952,000 | +9.24% |
Median Days on Market | 29 | 13 | +123.08% | 13 | 11 | +18.18% |
Average List Price (Solds) | $1,643,487 | $1,522,055 | +7.98% | $1,457,287 | $1,303,036 | +11.84% |
Average Sold Price | $1,606,500 | $1,530,722 | +4.95% | $1,430,331 | $1,289,536 | +10.92% |
Average Days on Market | 35 | 25 | +40.00% | 26 | 30 | -13.33% |
List/Sold Price Ratio | 99.2% | 100.7% | -1.5 | 99.6% | 99.5% | +0.08 |
Market data source: FMLS, July 2026. Figures reflect single-family residential activity in Sandy Springs.
What do the July 2026 numbers mean for Sandy Springs buyers?
For buyers, July 2026 brought more choice and a slower pace. New single-family listings jumped to 43 from 21 a year earlier, and median days on market climbed to 29 from 13 (FMLS, July 2026). That combination gives buyers more time to evaluate homes for sale in Sandy Springs and more room to negotiate than in the frenetic markets of recent years.
More inventory, more negotiating room
- New listings more than doubled year over year, widening the pool of Sandy Springs homes for sale.
- The list to sold price ratio eased to 99.2 percent from 100.7 percent, so buyers are less likely to face above-asking bidding.
- Longer days on market suggest sellers may be more open to reasonable offers, especially on homes that have sat past the median.
Where the price points sit
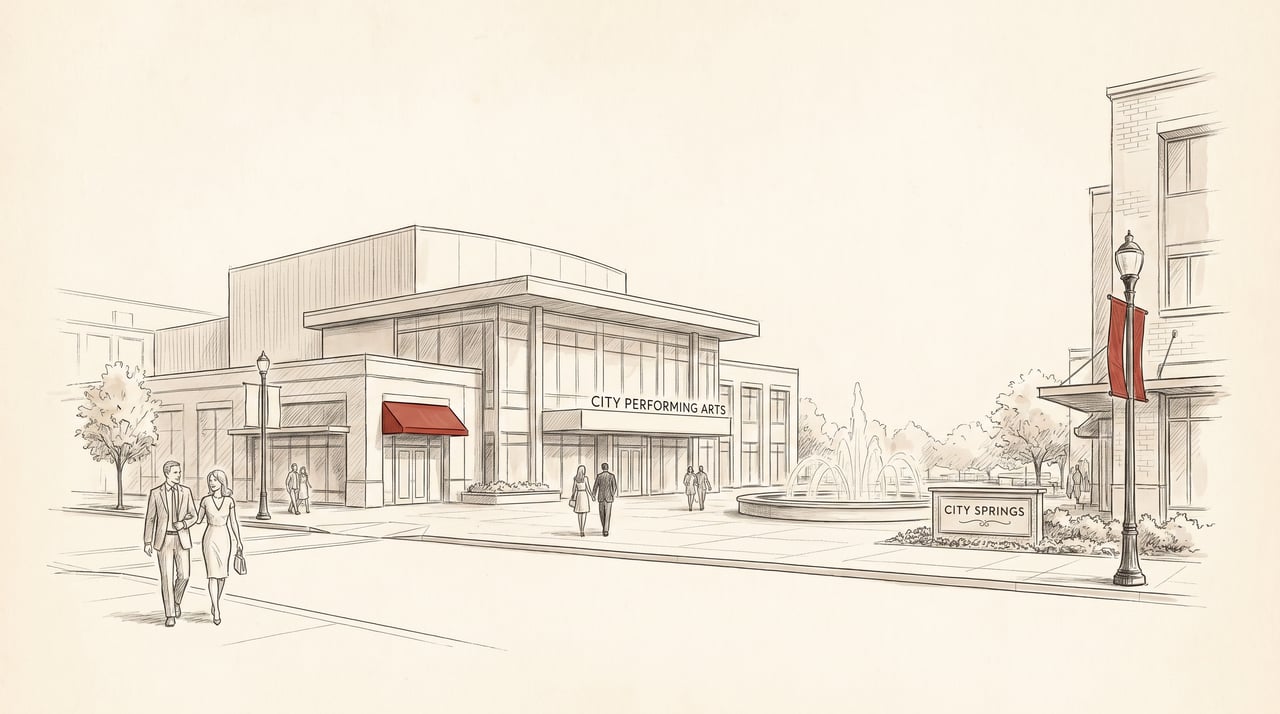
With a median sold price of $1,382,500 and an average sold price of $1,606,500, Sandy Springs remains a luxury single-family market. Buyers focused on neighborhoods near Roswell Road, the Sandy Springs City Springs district, or the streets bordering the Chattahoochee River National Recreation Area should plan financing around these ranges. Getting a market analysis before offering can help align expectations with current pricing.
What do the numbers mean for Sandy Springs sellers?
Sellers still hold a strong position, but the market rewards realistic pricing. The median sold price rose 31.17 percent year over year to $1,382,500, and homes closed at 99.2 percent of list (FMLS, July 2026). At the same time, days on market lengthened, so sharp pricing and preparation matter more now than they did a year ago.
Pricing to the current data
The gap between the median list price of solds ($1,345,000) and the median sold price ($1,382,500) indicates buyers paid at or slightly above asking on well-positioned homes. Sellers who price to the July 2026 data rather than to older peaks tend to attract stronger, faster offers.
Preparation still pays
- Stage and photograph before listing, since more competing inventory means presentation stands out.
- Request a pre-listing price opinion grounded in recent Sandy Springs comparables.
- Expect a longer marketing window than in July 2025 and plan showings accordingly.
How is inventory and days on market shifting across price ranges?
Inventory expanded in July 2026 while homes took longer to sell. New single-family listings reached 43 for the month and 251 year to date, up 25.50 percent from the prior year (FMLS, July 2026). Median days on market moved to 29 for July, though the year-to-date median held at a brisk 13, showing the summer month ran slower than the yearly pace.
Reading the days on market split
Monthly versus year to date
The July median of 29 days sits well above the 13-day year-to-date median, a normal seasonal pattern as summer inventory builds. Average days on market for July was 35, up from 25 a year earlier, while the year-to-date average of 26 actually improved from 30 in 2025 (a decline of 13.33 percent).
What that means for planning
Buyers gain a little breathing room during the summer months, and sellers should budget for a marketing window closer to a month rather than the near-instant sales seen at some peaks. For a fuller view, compare this update with prior Sandy Springs market reports and our neighboring Buckhead and Marietta coverage.
What does the outlook suggest for the Sandy Springs market?
The July 2026 data points to a market that is normalizing rather than cooling. Prices rose sharply year over year while inventory expanded and homes took longer to sell (FMLS, July 2026). Read together, these figures suggest a shift toward balance, though this is analysis of reported trends and not a prediction or guarantee of future results.
Signals worth watching
- Pricing power: A 99.2 percent list to sold ratio shows sellers still command near-asking prices.
- Supply: New listings up 104.76 percent for the month give buyers a wider selection.
- Pace: Longer July days on market indicate a steadier, less rushed transaction cycle.
Homeowners and buyers can track these indicators month to month using FMLS reporting and public resources such as the Georgia Association of Realtors and the Atlanta Regional Commission.
Frequently asked questions about the Sandy Springs market
Is now a good time to buy a home in Sandy Springs?
July 2026 offered buyers more options and a calmer pace than a year earlier. New single-family listings more than doubled to 43, and median days on market rose to 29 (FMLS, July 2026). The list to sold ratio eased to 99.2 percent, so bidding wars were less common. Whether the timing suits you depends on your budget, financing, and goals, but the data shows more inventory and slightly more negotiating room than in July 2025. Reviewing current Sandy Springs listings alongside a personalized market analysis is the best way to gauge fit.
How much did Sandy Springs home prices change year over year?
The median single-family sold price rose 31.17 percent, from $1,054,000 in July 2025 to $1,382,500 in July 2026 (FMLS, July 2026). The average sold price rose more modestly, up 4.95 percent to $1,606,500, which reflects the mix of homes that closed. Year to date, the median sold price is up 9.24 percent to $1,040,000. These figures describe reported activity and are not a forecast of future price movement.
How long are Sandy Springs homes taking to sell?
In July 2026, the median single-family home sold in 29 days, up from 13 a year earlier, and the average was 35 days (FMLS, July 2026). The year-to-date median stayed at 13 days, so the summer month ran slower than the annual pace. Homes priced to current comparables and prepared well generally move faster than those that follow older pricing.
What price range defines the Sandy Springs single-family market?
Sandy Springs is a luxury single-family market. July 2026 showed a median sold price of $1,382,500 and an average sold price of $1,606,500, with an average list price of solds near $1,643,487 (FMLS, July 2026). Buyers exploring neighborhoods near City Springs, Roswell Road, or the Chattahoochee River corridor should plan financing within these ranges.
Conclusion
The Sandy Springs real estate market in July 2026 combined strong prices with expanding supply. Three takeaways stand out: the median single-family sold price rose 31.17 percent year over year to $1,382,500, new listings more than doubled to 43, and homes took longer to sell at a median of 29 days (FMLS, July 2026). Together these point to a market moving toward balance while still favoring well-prepared sellers. Whether you are buying or selling, current data should guide your strategy. Schedule a consultation with a Sandy Springs specialist at The Agency Atlanta to build a plan around these numbers.