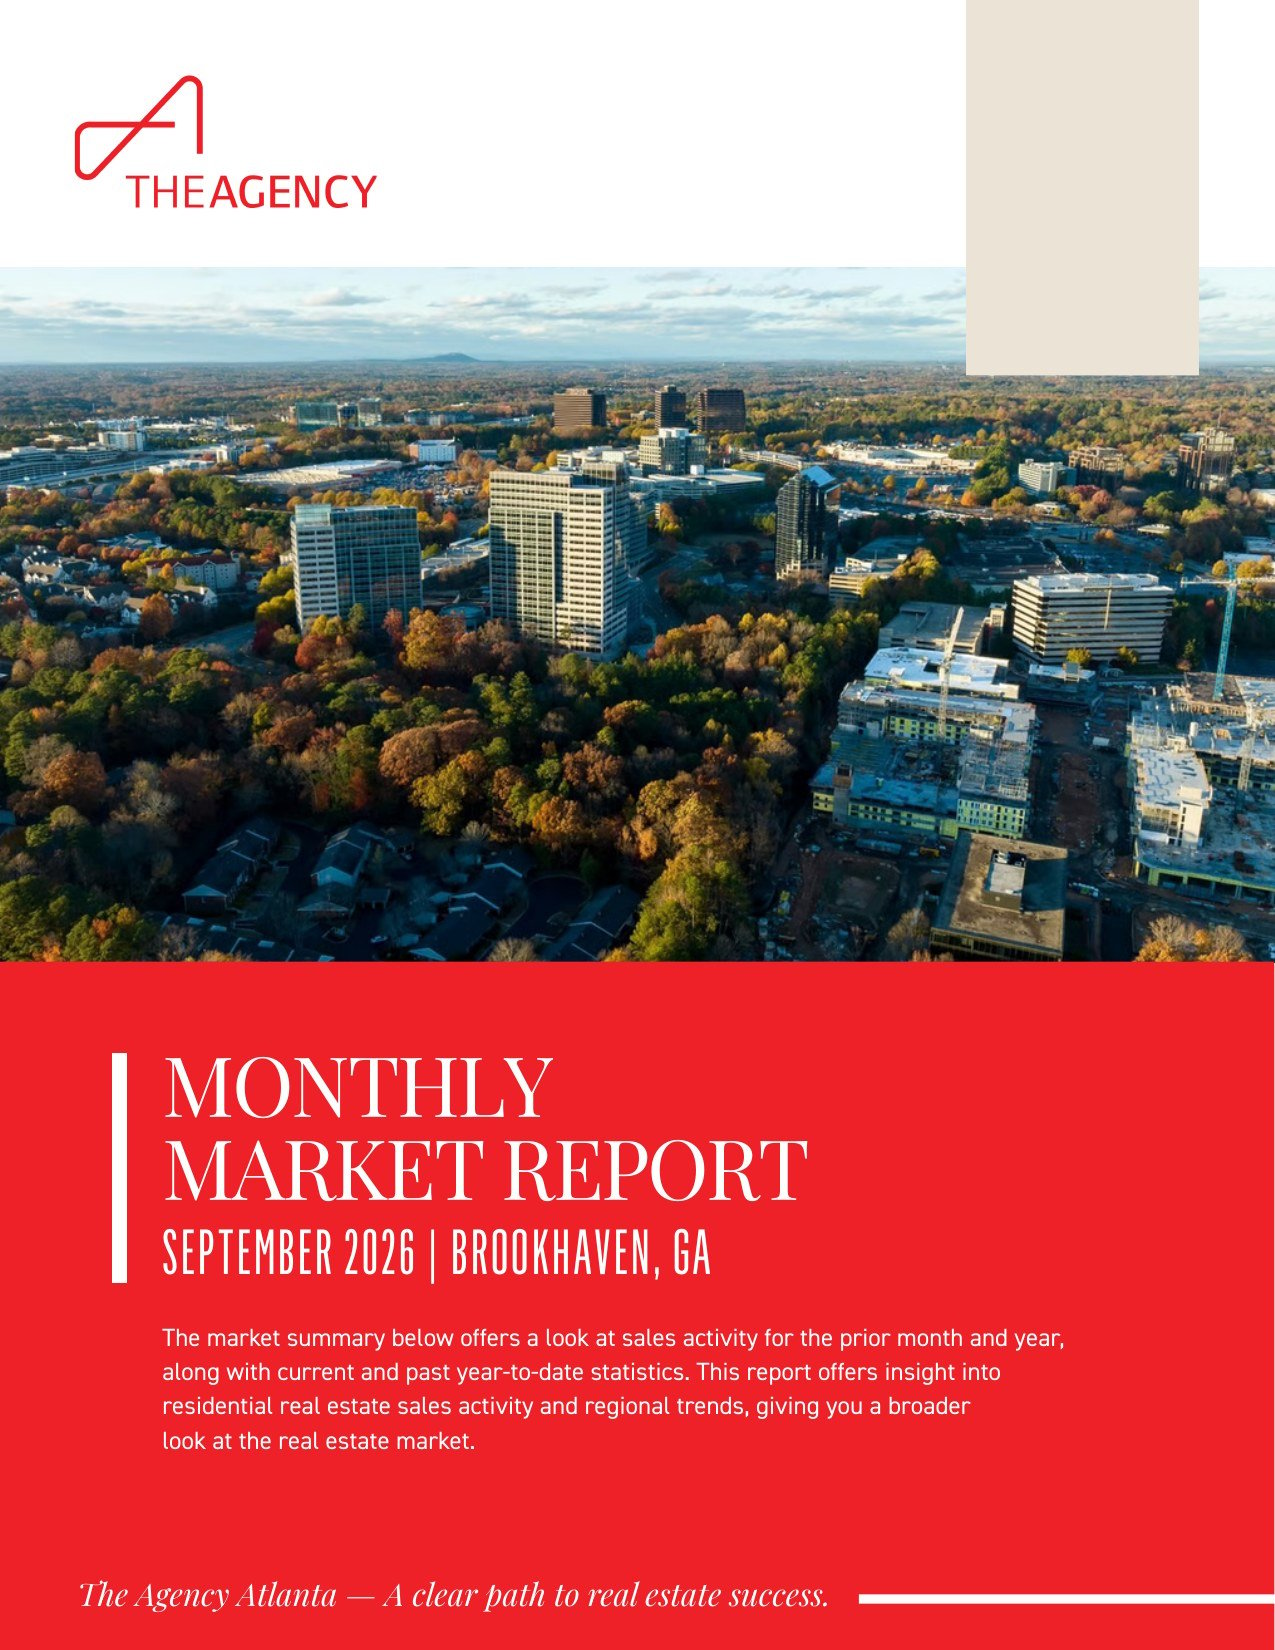
Single family and condo prices, sales pace and inventory across Brookhaven, Georgia
Brookhaven single family homes sold at a median price of $942,000 in September 2026, while the year-to-date median held at $975,000, up 2.23 percent from the same period in 2025 (FMLS, September 2026). That contrast between one month and the full year is the central story of the Brookhaven real estate market September 2026 report. A small number of closings can swing a monthly median, so the longer view carries more weight.
This update covers both segments FMLS tracks for Brookhaven, Georgia, a city in DeKalb County: single family homes and condos. It walks through the key numbers, price band inventory and months supply, then explains what the figures mean for buyers and sellers. Condo results deserve extra care this month, because the September figures rest on only 7 sales.
What Are the Key Numbers in the Brookhaven Real Estate Market September 2026?
In September 2026, Brookhaven recorded 18 single family sales at a median sold price of $942,000 and 7 condo sales at a median sold price of $650,000 (FMLS, September 2026). Single family homes spent a median of 21 days on market and closed at 97.6% of list price. Condos spent a median of 35 days on market and closed at 95.9% of list price.
Brookhaven Single Family Homes
Metric | September 2026 | September 2025 | Change | YTD 2026 | YTD 2025 | YTD Change |
|---|---|---|---|---|---|---|
New Listings | 24 | 34 | Down 29.41% | 305 | 423 | Down 27.9% |
Sold Listings | 18 | 28 | Down 35.71% | 189 | 226 | Down 16.37% |
Median Sold Price | $942,000 | $1,302,500 | Down 27.68% | $975,000 | $953,750 | Up 2.23% |
Median Days on Market | 21 | 23 | Down 8.7% | 13 | 16 | Down 18.75% |
Average Sold Price | $1,164,825 | $1,344,232 | Down 13.35% | $1,190,239 | $1,149,428 | Up 3.55% |
List/Sold Price Ratio | 97.6% | 99.4% | Down 1.88% | 99.2% | 98.6% | Up 0.64% |
Market data source: FMLS, September 2026. Figures reflect single family residential activity in Brookhaven.
The September median fell 27.68 percent against a high $1,302,500 comparison from September 2025, yet the year-to-date median rose 2.23 percent and the year-to-date average sold price rose 3.55 percent. With only 18 closings in the month, the mix of homes sold shapes the monthly median heavily.
Brookhaven Condos
Metric | September 2026 | September 2025 | Change | YTD 2026 | YTD 2025 | YTD Change |
|---|---|---|---|---|---|---|
New Listings | 22 | 23 | Down 4.35% | 199 | 221 | Down 9.95% |
Sold Listings | 7 | 20 | Down 65% | 80 | 119 | Down 32.77% |
Median Sold Price | $650,000 | $495,000 | Up 31.31% | $655,000 | $505,000 | Up 29.7% |
Median Days on Market | 35 | 29 | Up 20.69% | 39 | 33 | Up 18.18% |
Average Sold Price | $565,500 | $515,446 | Up 9.71% | $625,716 | $524,039 | Up 19.4% |
List/Sold Price Ratio | 95.9% | 98.2% | Down 2.33% | 97.9% | 98.5% | Down 0.64% |
Market data source: FMLS, September 2026. Figures reflect condo residential activity in Brookhaven. September figures rest on 7 sales.
Seven sales is a small sample, and a few higher-priced closings can lift a median sharply. The year-to-date figures, built on 80 sales, offer firmer footing and point the same way, with the median sold price up 29.7 percent to $655,000. Brookhaven condos also took longer to sell, and the September ratio of 95.9% was the lowest in either segment this month.
Where Is Brookhaven Inventory Concentrated by Price Band?
FMLS data for September 2026 shows Brookhaven single family inventory concentrated at $750K and above, while condo inventory spreads across a much wider price range. Single family months supply sat at about 3.0, compared with about 3.2 in August. Condo months supply was about 9.7, down from about 11 in August but well above the readings under 5 seen for most of 2024 and 2025.
Single Family Inventory
The $750K to $999K and $1.5M and above bands each held about 18 active listings, the most of any range, followed by $1M to $1.5M at about 16 (FMLS, September 2026). The $500K to $749K band held about 10, the $400K to $499K band about 2, and nothing was listed under $400K. List price per square foot ranged from about $310 in the $750K to $999K band to about $450 in the $400K to $499K band.
Single Family Pace by Price Band
- $750K to $999K: about 21 days on market over the previous 12 months, the fastest band
- $1M to $1.5M: about 29 days
- $400K to $499K and $500K to $749K: about 35 to 36 days
- $1.5M and above: about 42 days, the slowest band
Condo Inventory
The $500K to $749K band held the most active condo listings at about 16, followed by $200K to $299K at about 14 and $750K to $999K at about 12. Under $200K held about 11, while the $300K to $399K, $400K to $499K and $1M to $1.5M bands held fewer. List price per square foot ranged from about $165 to about $330.
Condo Pace by Price Band
- $750K to $999K: about 46 days over the previous 12 months, the fastest band
- $500K to $749K and $400K to $499K: about 59 to 60 days
- Under $400K: about 74 to 78 days
- $1.5M and above: about 95 days, the slowest band
What Does the September 2026 Data Mean for Buyers in Brookhaven?
Buyers in Brookhaven had somewhat more negotiating room in September 2026 than the year-to-date figures reflect. Single family homes closed at 97.6% of list price and condos at 95.9% (FMLS, September 2026). Condo buyers have the widest choice, with about 9.7 months of supply, while single family buyers still shop in a tighter market near 3 months of supply.
Single Family Buyers
- Homes in the $750K to $999K band have moved fastest, at about 21 days over the previous 12 months.
- New listings totaled 24 in September, so selection at any one time stays limited.
- Homes priced at $1.5M and above have taken longer, at about 42 days.
Condo Buyers
With elevated months supply and a median of 35 days on market, condo buyers can generally compare several options before making an offer. Brookhaven homes for sale in the condo segment reach from under $200K to the $1M to $1.5M band.
Location Context
Brookhaven sits between Buckhead and Chamblee, with access to I-85, I-285 and nearby GA 400. The Peachtree Road corridor links Town Brookhaven, the Brookhaven/Oglethorpe MARTA station and the Oglethorpe University campus, while Dresden Drive and Buford Highway serve as other main routes. Neighborhoods such as Historic Brookhaven, Ashford Park, Drew Valley and Lynwood Park sit across the city, along with green space at Murphey Candler Park and Blackburn Park. The Brookhaven neighborhood guide covers these areas in more detail.
What Does the September 2026 Data Mean for Sellers in Brookhaven?
Brookhaven single family sellers still operate in a market with about 3.0 months of supply and a year-to-date list to sold price ratio of 99.2% (FMLS, September 2026). September showed a softer pace, with a 97.6% ratio and a 21-day median. Condo sellers face more competition, with about 9.7 months of supply and longer marketing times across most price bands.
Single Family Sellers
- The September ratio of 97.6% shows buyers responding closely to list price.
- A year-to-date median of 13 days on market shows that homes priced in line with recent sales can still move quickly.
- New listings were down 29.41 percent in September, which limits direct competition.
Condo Sellers
Condo sellers benefit from a careful price opinion before listing, since the September ratio of 95.9% and average days on market of 50 point to buyers who take their time. Presentation, accurate pricing and patience carry more weight in this segment of the DeKalb County real estate market.
How Should Buyers and Sellers Read the Brookhaven Market Trends?
The September 2026 FMLS data points to a split Brookhaven market rather than a single direction. Single family homes show steady full-year pricing, faster year-to-date sales and supply near 3 months. Condos show rising year-to-date prices alongside longer days on market and supply near 9.7 months. This is an analysis of current figures, not a statement about future prices.
Signals to Watch
- Single family months supply, which eased to about 3.0 from about 3.2 in August
- Condo months supply, which fell to about 9.7 from about 11 in August
- List to sold price ratios, which ran below year-to-date levels in both segments in September
- New listing counts, which ran below 2025 levels year to date in both segments
Context From Earlier Reports
For prior period figures on both segments, the Brookhaven August 2026 market report offers a useful comparison. Statewide housing resources are available from the Georgia Association of REALTORS, and listing data for this report comes from First Multiple Listing Service (FMLS).
Brookhaven Real Estate Market Update: Frequently Asked Questions
The questions below address common points buyers and sellers raise about the Brookhaven real estate market in September 2026. Each answer draws only on FMLS figures for single family homes and condos in Brookhaven, Georgia, and reflects market analysis rather than any statement about future prices.
Are Brookhaven home prices falling in September 2026?
The September 2026 single family median sold price of $942,000 was down 27.68 percent from September 2025, but that month rested on 18 sales (FMLS, September 2026). The year-to-date median sold price tells a steadier story at $975,000, up 2.23 percent from 2025. Condo medians moved the other way, rising 31.31 percent in September and 29.7 percent year to date. Monthly medians can shift with the mix of homes that close, so the year-to-date figures offer a more reliable read.
How long does it take to sell a home in Brookhaven?
In September 2026, Brookhaven single family homes spent a median of 21 days on market, and condos spent a median of 35 days (FMLS, September 2026). Year to date, the single family median was 13 days and the condo median was 39 days. Over the previous 12 months, single family homes in the $750K to $999K range moved fastest at about 21 days, while condos priced at $1.5M and above took about 95 days.
Is Brookhaven a buyer's market or a seller's market right now?
The answer depends on the segment. Single family months supply was about 3.0 in September 2026, a level generally read as leaning toward sellers (FMLS, September 2026). Condo months supply was about 9.7, which leans toward buyers, even after easing from about 11 in August. Both segments closed below their year-to-date list to sold price ratios in September, so buyers in each found some room to negotiate.
Why are Brookhaven condo figures less reliable this month?
Brookhaven recorded only 7 condo sales in September 2026, compared with 20 in September 2025 (FMLS, September 2026). With a sample that small, one or two closings at higher or lower price points can move the median, the average and the list to sold price ratio noticeably. The year-to-date condo figures, based on 80 sales, give a broader view, with a median sold price of $655,000 and a median of 39 days on market.
What Is the Bottom Line for Brookhaven in September 2026?
The Brookhaven real estate market in September 2026 shows two distinct segments. Single family homes posted a lower monthly median but steady year-to-date pricing, quick sales and supply near 3 months. Condos showed higher prices on a small 7-sale sample, with longer marketing times and supply near 9.7 months (FMLS, September 2026).
Single family sellers can still expect solid demand when pricing aligns with recent sales, and condo buyers have more choice than for most of 2024 and 2025.
To discuss pricing, timing or current listings in a specific Brookhaven neighborhood, connect with an agent at The Agency Atlanta.