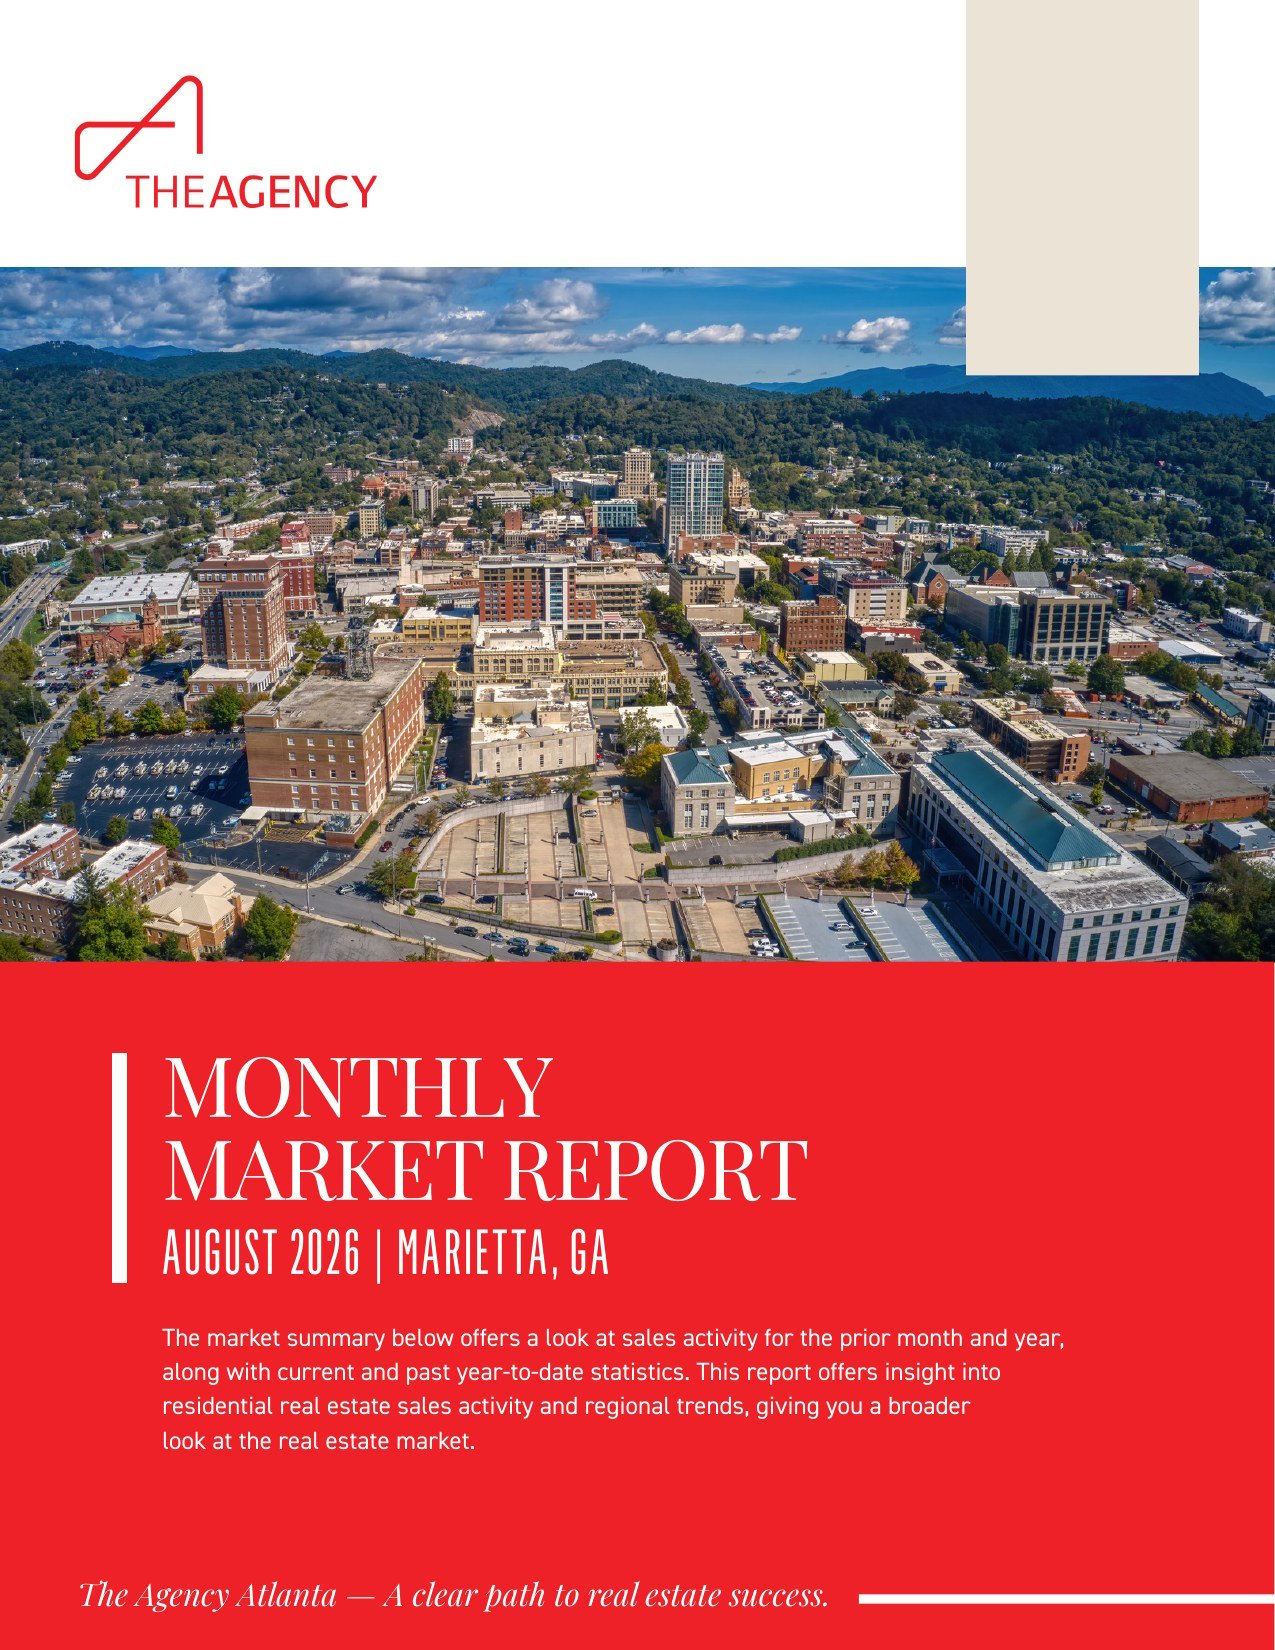
Higher median prices, slower sales, and a deeper supply of single-family homes in Marietta
The median sold price for a single-family home in Marietta reached $540,000 in August 2026, up 6.51 percent from $507,000 in August 2025 (FMLS, August 2026). That gain arrived alongside fewer closed sales and slightly longer marketing times, a combination that defines the Marietta real estate market August 2026 picture for buyers and sellers.
This Marietta real estate market update covers single-family activity across Marietta mailing addresses, which include the city itself and surrounding unincorporated Cobb County. It walks through the key numbers for the month and the year to date, inventory by price band, what the figures mean for buyers and sellers, and what current trends suggest as analysis.
What Are the Key Numbers in the Marietta Real Estate Market August 2026?
Marietta single-family homes posted a median sold price of $540,000 in August 2026, with 232 sales, 378 new listings, a median of 25 days on market, and a list to sold price ratio of 98 percent (FMLS, August 2026). Prices rose from August 2025, while sales and new listings declined and homes took slightly longer to sell.
August 2026 Compared with August 2025
Metric | August 2026 | August 2025 | Change |
|---|---|---|---|
New Listings | 378 | 390 | -3.08% |
Sold Listings | 232 | 257 | -9.73% |
Median List Price (Solds) | $550,000 | $515,000 | 6.8% |
Median Sold Price | $540,000 | $507,000 | 6.51% |
Median Days on Market | 25 | 24 | 4.17% |
Average List Price (Solds) | $626,915 | $615,715 | 1.82% |
Average Sold Price | $612,087 | $602,582 | 1.58% |
Average Days on Market | 39 | 35 | 11.43% |
List/Sold Price Ratio | 98% | 98.2% | -0.22% |
Market data source: FMLS, August 2026. Figures reflect single-family residential activity in Marietta.
Where the Data Comes From
These figures are drawn from the First Multiple Listing Service (FMLS), a regional listing service used across metro Atlanta. For the prior month, the Marietta real estate market report for July 2026 covers July activity.
How Does Marietta's Year to Date Activity Compare with 2025?
Through August 2026, Marietta recorded 3,536 new single-family listings and 2,085 sales, both ahead of the same period in 2025 (FMLS, August 2026). The year to date median sold price of $535,000 sits 0.93 percent below the $540,000 recorded a year earlier, and median days on market rose to 20 from 16.
Year to Date 2026 Compared with Year to Date 2025
Metric | YTD 2026 | YTD 2025 | Change |
|---|---|---|---|
New Listings | 3,536 | 3,353 | 5.46% |
Sold Listings | 2,085 | 2,046 | 1.91% |
Median List Price (Solds) | $547,000 | $549,000 | -0.36% |
Median Sold Price | $535,000 | $540,000 | -0.93% |
Median Days on Market | 20 | 16 | 25% |
Average List Price (Solds) | $635,817 | $649,634 | -2.13% |
Average Sold Price | $625,874 | $641,282 | -2.4% |
Average Days on Market | 38 | 33 | 15.15% |
List/Sold Price Ratio | 98.6% | 98.9% | -0.28% |
Reading the Two Timeframes Together
August's median sold price of $540,000 stands above the 2026 year to date median of $535,000, even though the year to date median still trails 2025. Year to date average sold price fell 2.4 percent, while August's average sold price rose 1.58 percent (FMLS, August 2026).
Which Price Bands Hold the Most Marietta Homes for Sale?
FMLS data for August 2026 shows the $300K to $499K band holding the largest share of active single-family listings in Marietta at the end of the month, with about 330 homes. The $500K to $699K band followed with about 247, and months of supply reached about 3.6, up from about 2.5 in spring 2026 (FMLS, August 2026).
Active Listings and Days on Market by Price Band
Price Band | Active Listings, End of August 2026 | Days on Market, Previous 12 Months |
|---|---|---|
$200K to $299K | About 30 | About 34 |
$300K to $499K | About 330 | About 40 |
$500K to $699K | About 247 | About 37 |
$700K to $1M | About 193 | About 36 |
$1M and above | About 115 | About 42 |
Pace by Price Band
Very few homes were listed under $200K, though the $150K to $199K band moved fastest over the previous 12 months at about 27 days, and the $100K to $149K band was slowest at about 56. Above $200K, pace ranged from about 34 days in the $200K to $299K band to about 42 days at $1M and above (FMLS, August 2026).
What Months of Supply Shows
Months of supply measured about 3.6 in August 2026, compared with a four-month average of about 3 and a reading near 2.5 in spring 2026 (FMLS, August 2026). A rising figure means the current sales pace would take longer to absorb available homes. By common industry convention, this level still leans toward sellers, although that lean has eased since spring.
What Does the August 2026 Market Mean for Buyers in Marietta?
Buyers in Marietta are working with more choice and a little more time than in spring 2026, as months of supply rose to about 3.6 and median days on market reached 25 (FMLS, August 2026). Prices remain firm, with a $540,000 median sold price and homes selling at 98 percent of list price, so preparation still matters.
Conditions Working in a Buyer's Favor
- Average days on market rose to 39 from 35, allowing more time to compare homes.
- The list to sold price ratio eased to 98 percent from 98.2 percent, a modest shift toward negotiation.
- Months of supply near 3.6, up from about 2.5 in spring 2026, points to more choice among homes for sale in Marietta.
Factors That Still Call for Preparation
- The median sold price rose 6.51 percent from August 2025, so budgets set a year ago may need review.
- A median of 25 days on market means many well-priced homes still sell quickly.
- Pace varies by price band, so recent sales in the targeted band offer the clearest reference point.
What Should Marietta Sellers Know About Pricing Right Now?
Sellers in Marietta are still achieving firm pricing, with a median sold price of $540,000 and a list to sold price ratio of 98 percent in August 2026 (FMLS, August 2026). Buyers have more options than in spring, however, and average days on market reached 39, so accurate pricing and presentation carry more weight than earlier in the year.
Signals Supporting Sellers
- The median list price of sold homes rose 6.8 percent to $550,000.
- New listings fell 3.08 percent to 378, limiting fresh competition during the month.
- Months of supply near 3.6 still leans toward sellers by common industry convention.
Signals That Call for Care
- Sold listings declined 9.73 percent to 232 compared with August 2025.
- Year to date average days on market rose 15.15 percent to 38.
- Homes at $1M and above averaged about 42 days on market over the previous 12 months.
A price opinion based on recent sales in the same price band can clarify where a property fits as supply builds.
Where Does Marietta Single-Family Activity Take Place?
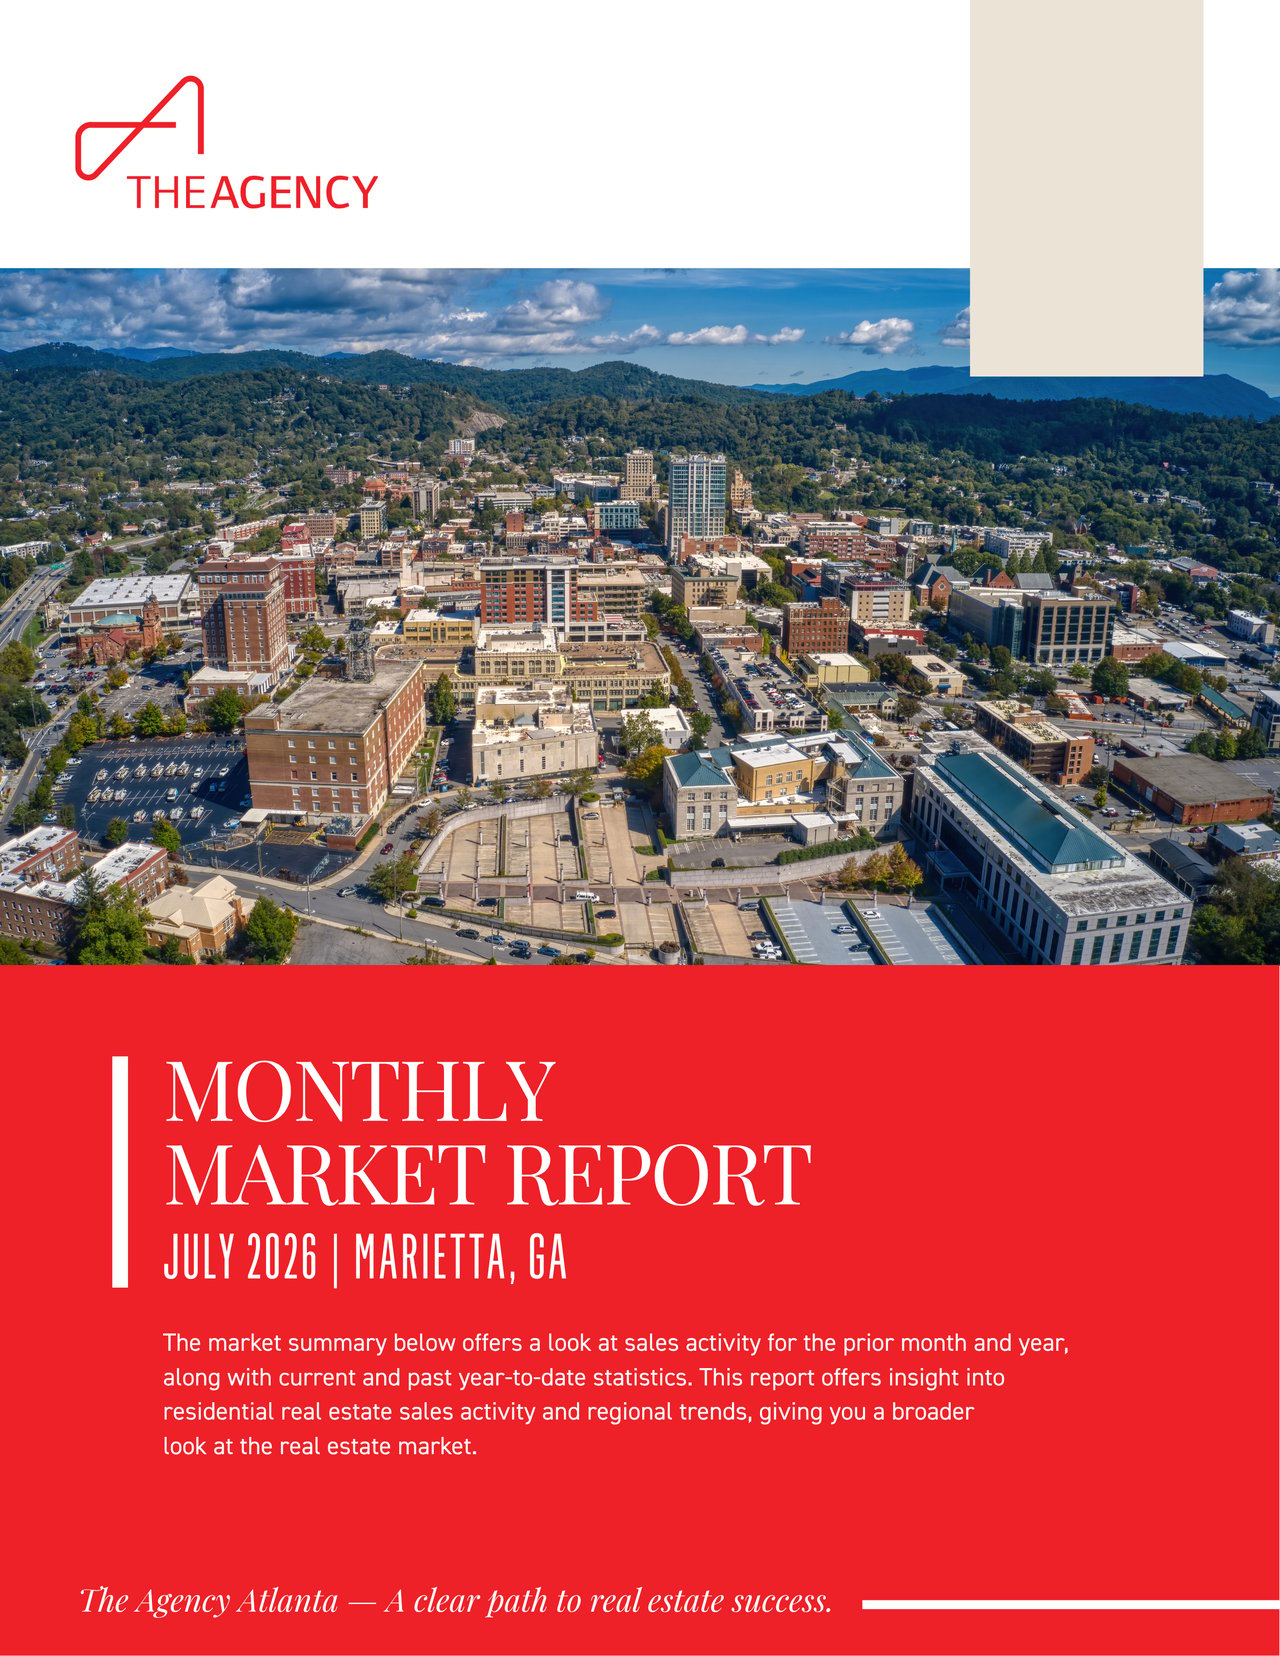
Marietta single-family figures cover homes with Marietta mailing addresses, spanning both the city of Marietta and surrounding unincorporated Cobb County. That area reaches from historic Marietta Square toward Kennesaw Mountain National Battlefield Park and east into parts of East Cobb, with Interstate 75 and Interstate 575 providing access about 20 miles northwest of downtown Atlanta.
Landmarks and Corridors
- Marietta Square and Glover Park: the historic center of the city, with the Earl Smith Strand Theatre on the Square.
- Whitlock Avenue: a corridor leading west from the Square toward Kennesaw Mountain National Battlefield Park.
- Roswell Road and Powers Ferry Road: routes serving the eastern portion of the Marietta mailing area, including parts of East Cobb.
- Cobb Parkway (U.S. Highway 41) and the South Loop 120 corridor: routes linking areas around the city center.
Coverage Beyond City Limits
Because the data includes unincorporated addresses, it also offers a view of Cobb County real estate beyond the city limits of Marietta. For more on local landmarks and property options, explore the Marietta neighborhood guide.
What Do the August 2026 Trends Suggest for Marietta?
Taken together, the August 2026 figures describe a Marietta market moving gradually toward balance rather than shifting sharply (FMLS, August 2026). Median prices were higher than a year earlier, but slower sales, longer days on market, and months of supply near 3.6 indicate that buyers have gained some flexibility. These readings are analysis of current conditions, not a forecast.
Trends Worth Watching
- Supply direction: months of supply climbed from about 2.5 in spring 2026 to about 3.6.
- Sales pace: sold listings fell 9.73 percent for the month but rose 1.91 percent year to date.
- Negotiating room: the list to sold price ratio eased in both the monthly and year to date views.
Placing Local Data in Broader Context
Monthly figures can shift with the mix of homes that close, so a single month is best read alongside year to date results. Statewide housing research from the Georgia Association of REALTORS can help frame Marietta's numbers within wider Georgia trends.
Marietta Real Estate Market FAQ
The questions below address common buyer and seller topics about Marietta single-family homes using FMLS data for August 2026. Each answer draws only on reported figures and approximate readings from that data set, and none should be read as a forecast of future prices or market conditions.
What was the median home price in Marietta in August 2026?
The median sold price for Marietta single-family homes was $540,000 in August 2026, up 6.51 percent from $507,000 in August 2025, according to FMLS. The median list price of homes that sold was $550,000. For the year to date, the median sold price was $535,000, slightly below the $540,000 recorded through the same period of 2025.
How long does it take to sell a house in Marietta right now?
Marietta single-family homes spent a median of 25 days on market in August 2026, compared with 24 days in August 2025 (FMLS, August 2026). The average was 39 days, up from 35. Over the previous 12 months, homes at $1M and above took about 42 days. Pricing, condition, and location all influence how quickly a specific home sells.
Is Marietta a buyer's market or a seller's market in August 2026?
FMLS data for August 2026 shows about 3.6 months of supply for Marietta single-family homes, a level that still leans toward sellers by common industry convention. That lean has eased since spring 2026, when months of supply was about 2.5. Homes sold at 98 percent of list price, down slightly from 98.2 percent a year earlier, and conditions differ by price band.
Are home prices in Marietta rising or falling?
The answer depends on the timeframe. In August 2026, the median sold price rose 6.51 percent from August 2025 to $540,000 (FMLS, August 2026). On a year to date basis, the median sold price of $535,000 was down 0.93 percent, and the average sold price was down 2.4 percent. These figures describe completed sales and do not indicate future price direction.
Key Takeaways from the Marietta Market in August 2026
Marietta's August 2026 single-family market combined higher median prices with slower sales and a growing supply of homes (FMLS, August 2026). The median sold price reached $540,000, homes sold at 98 percent of list price, and months of supply rose to about 3.6, giving buyers more options while sellers continue to see firm pricing.
- Prices rose from August 2025 even as sold listings declined 9.73 percent.
- Inventory and pace vary by price band, with the most active listings in the $300K to $499K range.
For a detailed price opinion or a tour of Marietta homes for sale, connect with an agent at The Agency Atlanta.