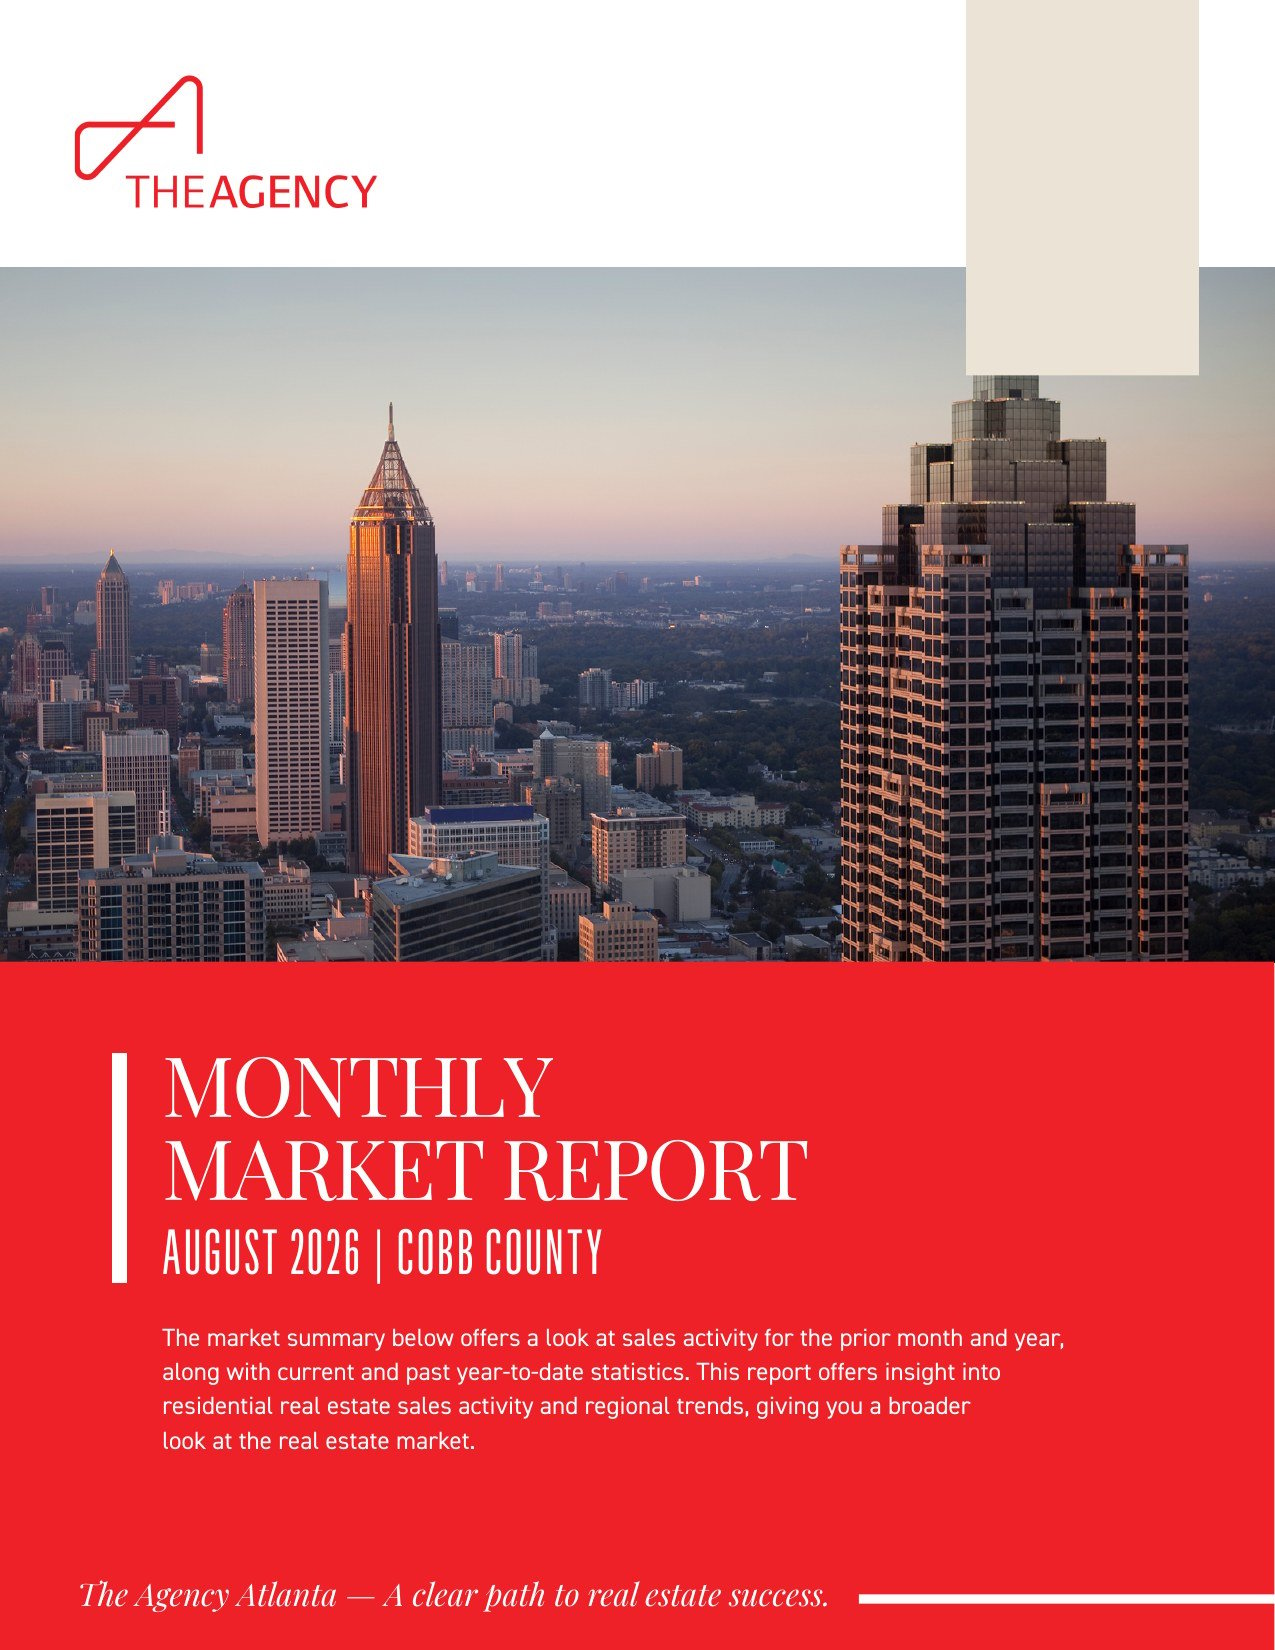
August 2026 FMLS data shows steady Cobb County prices and a slower sales pace
Single-family homes across Cobb County sold at a median price of $462,000 in August 2026, down 1.07 percent from $467,000 in August 2025, according to FMLS. That modest shift frames the Cobb County real estate market August 2026 picture: prices stayed close to last year's levels while the pace of sales slowed and homes spent more time on the market.
This countywide update covers the monthly and year to date figures, inventory by price band, what the data means for buyers and sellers, and an analytical outlook. All statistics come from First Multiple Listing Service (FMLS) and reflect single-family activity across Marietta, Smyrna, Kennesaw, Acworth, Powder Springs and Austell, plus unincorporated communities such as East Cobb, Mableton and Vinings.
What Are the Key Numbers in the Cobb County Real Estate Market August 2026?
In August 2026, Cobb County recorded 911 new single-family listings and 574 sales, with a median sold price of $462,000 and a median of 27 days on market (FMLS, August 2026). The list to sale price ratio was 98.2 percent. Compared with August 2025, median prices dipped slightly, sales fell 9.61 percent and homes took longer to sell.
August 2026 Compared With August 2025
Metric | August 2026 | August 2025 | Change |
|---|---|---|---|
New Listings | 911 | 925 | Down 1.51% |
Sold Listings | 574 | 635 | Down 9.61% |
Median List Price (Solds) | $472,450 | $475,000 | Down 0.54% |
Median Sold Price | $462,000 | $467,000 | Down 1.07% |
Median Days on Market | 27 | 24 | Up 12.5% |
Average List Price (Solds) | $562,578 | $555,935 | Up 1.19% |
Average Sold Price | $550,408 | $545,079 | Up 0.98% |
Average Days on Market | 42 | 40 | Up 5% |
List/Sold Price Ratio | 98.2% | 98.4% | Down 0.14% |
Market data source: FMLS, August 2026. Figures reflect single-family residential activity in Cobb County, Georgia.
Prices Held Steady as the Pace Slowed
The median list price for sold homes eased 0.54 percent to $472,450, while the average sold price rose 0.98 percent to $550,408 (FMLS, August 2026). When averages rise as medians soften, the pattern often reflects a stronger share of higher-priced sales in the monthly mix.
How Does Cobb County's 2026 Year to Date Compare With 2025?
Through August 2026, Cobb County activity ran slightly ahead of 2025 in volume while prices held essentially flat. New listings rose 4.27 percent to 8,325 and sales rose 2.85 percent to 4,912, while the median sold price eased 0.44 percent to $475,000 (FMLS, August 2026). The clearest change is time, with median days on market rising to 23 from 20.
Year to Date Figures
Metric | YTD 2026 | YTD 2025 | Change |
|---|---|---|---|
New Listings | 8,325 | 7,984 | Up 4.27% |
Sold Listings | 4,912 | 4,776 | Up 2.85% |
Median List Price (Solds) | $480,500 | $480,000 | Up 0.1% |
Median Sold Price | $475,000 | $477,100 | Down 0.44% |
Median Days on Market | 23 | 20 | Up 15% |
Average List Price (Solds) | $576,419 | $575,988 | Up 0.07% |
Average Sold Price | $566,496 | $567,671 | Down 0.21% |
Average Days on Market | 41 | 37 | Up 10.81% |
List/Sold Price Ratio | 98.4% | 98.7% | Down 0.23% |
What the Year to Date Trend Shows
- More choice: new listings grew faster than sales over the year.
- Stable pricing: the median list price for sold homes was $480,500, up 0.1 percent.
- Longer marketing periods: average days on market climbed 10.81 percent to 41.
- Slightly more negotiation: the list to sale price ratio measured 98.4 percent, down from 98.7 percent.
Cobb County Single-Family Homes: Inventory and Price Band Breakdown
Inventory in Cobb County is concentrated below $500K, and supply has grown since spring. FMLS data for August 2026 shows the $300K to $499K band holding the largest share of active single-family listings, with about 970 homes, and a months supply of about 3.5, up from roughly 2.5 to 2.8 months in spring 2026.
Active Listings by Price Band
At the end of August 2026, active listings were distributed as follows (FMLS, August 2026).
Under $500K
- $300K to $499K: about 970 active listings, the largest band
- $200K to $299K: about 125 active listings
- Under $200K: very few active listings
$500K and Above
- $500K to $699K: about 540 active listings
- $700K to $1M: about 400 active listings
- $1M and above: about 190 active listings
Months Supply of Inventory
Months supply reached about 3.5 in August 2026, compared with a four-month average of about 3 and readings of roughly 2.5 to 2.8 in spring 2026 (FMLS, August 2026). The August reading remains below the range commonly associated with a balanced market, so conditions still lean toward sellers, though less firmly than earlier in the year.
Days on Market by Price Band
Over the 12 months through August 2026, FMLS data shows these approximate days on market, from fastest to slowest.
- $150K to $199K: about 36 days
- $500K to $699K: about 39 days
- $700K to $1M: about 41 days
- $200K to $499K: about 42 days
- $1M and above: about 45 days
- $0 to $99K: about 48 days
What Does the August 2026 Market Mean for Cobb County Buyers?
Buyers in Cobb County have more time and more selection than they did in spring. Median days on market rose to 27, the list to sale price ratio eased to 98.2 percent and months supply reached about 3.5 (FMLS, August 2026). Well-priced homes still sell close to asking, so preparation remains essential even as negotiating room improves.
How Buyers Can Use Current Conditions
- Study recent sales: the price point you target shapes the level of competition you face.
- Watch days on market: homes listed well beyond the county median of 27 days may offer more room to discuss price and terms.
- Look across bands: the $500K to $699K band offers about 540 active listings and has moved relatively quickly over the past 12 months.
Location and Access Across Cobb County
Cobb County homes for sale span settings from the blocks around Marietta Square to the Cumberland area, home to The Battery Atlanta and Truist Park. Landmarks include Kennesaw Mountain National Battlefield Park, Lake Acworth, the Silver Comet Trail and the Chattahoochee River National Recreation Area along the county's eastern edge. Access routes include I-75, I-285 and I-575, with I-20 along the south. Explore individual communities through the Cobb County neighborhood guide.
What Should Cobb County Sellers Know in August 2026?
Sellers in Cobb County are still receiving strong offers, but buyers are taking more time to commit. The median sold price was $462,000, the list to sale price ratio was 98.2 percent and median days on market rose 12.5 percent to 27 (FMLS, August 2026). Accurate pricing from the first day on market carries more weight as months supply climbs.
Pricing and Preparation
- Price to recent sales: a detailed market analysis based on current FMLS activity positions a home against competing listings in its band.
- Plan for a longer runway: the year to date median days on market is 23, up from 20 in 2025.
- Know the competition: the $300K to $499K band holds the deepest pool of active listings, about 970 homes.
- Present the home well: with more choice available, condition and photography influence how quickly buyers respond.
Reading the Price Signals
Median sold prices eased while average sold prices rose, so results vary by price point. Homes at $1M and above took about 45 days over the past 12 months, so sellers in the upper bands may benefit from planning for a longer marketing period.
Cobb County Market Outlook: What Do the Trends Suggest?
The data points to a Cobb County market moving gradually toward balance rather than a sharp change in either direction. Prices have held close to 2025 levels, year to date sales are up 2.85 percent and months supply has risen to about 3.5 (FMLS, August 2026). This is an analysis of current trends, not a forecast of future prices.
Signals Worth Watching
- Months supply: further gains from about 3.5 would indicate an easing seller advantage, while a decline would point to tighter conditions.
- Days on market: the move from 24 to 27 median days in August is a useful measure of buyer urgency.
- List to sale price ratio: readings of 98.2 percent in August and 98.4 percent year to date show pricing remains firm.
For month over month context, compare these figures with the Cobb County July 2026 market report, and see the Georgia Association of REALTORS for statewide housing perspective.
What Do Buyers and Sellers Ask About the Cobb County Market?
Most questions about Cobb County single-family homes focus on price, pace and negotiating room. The answers below draw on FMLS data for August 2026, including a median sold price of $462,000, a median of 27 days on market and a months supply of about 3.5.
What is the median home price in Cobb County in August 2026?
The median sold price for single-family homes in Cobb County was $462,000 in August 2026, down 1.07 percent from $467,000 in August 2025 (FMLS, August 2026). Year to date, the median sold price was $475,000, down 0.44 percent from $477,100 in 2025. The average sold price was higher at $550,408, reflecting the influence of sales at upper price points.
How long does it take to sell a house in Cobb County?
In August 2026, single-family homes in Cobb County spent a median of 27 days on market, up from 24 in August 2025 (FMLS, August 2026). Timing varies by price band. Over the 12 months through August 2026, homes priced $150K to $199K sold in about 36 days, while homes at $1M and above took about 45 days. Pricing, condition and presentation all influence where a specific home falls.
Is Cobb County a buyer's or seller's market right now?
Cobb County still leans toward sellers, though conditions are less competitive than in spring 2026. Months supply reached about 3.5 in August 2026, up from roughly 2.5 to 2.8 in spring, and the list to sale price ratio was 98.2 percent (FMLS, August 2026). Rising days on market give buyers more time to evaluate options, while sellers still achieve prices close to asking when homes are priced in line with recent sales.
Are there more homes for sale in Cobb County than last year?
Year to date through August 2026, Cobb County recorded 8,325 new single-family listings, up 4.27 percent from 7,984 in 2025 (FMLS, August 2026). In August alone, new listings were 911, down 1.51 percent from 925. With months supply at about 3.5, buyers have a wider selection of homes for sale in Cobb County than earlier in the year, led by the $300K to $499K band.
Key Takeaways From the Cobb County Market in August 2026
Cobb County's single-family market in August 2026 combined stable pricing with a slower pace. The median sold price was $462,000, median days on market rose to 27 and months supply reached about 3.5 (FMLS, August 2026), signaling more balanced conditions than in spring.
- Prices held close to 2025 levels on both a monthly and year to date basis.
- Buyers have more selection and time, especially in the $300K to $499K band.
- Sellers continue to see a 98.2 percent list to sale price ratio, making accurate pricing essential.
For a tailored price opinion or guidance on your next move, connect with an agent at The Agency Atlanta.