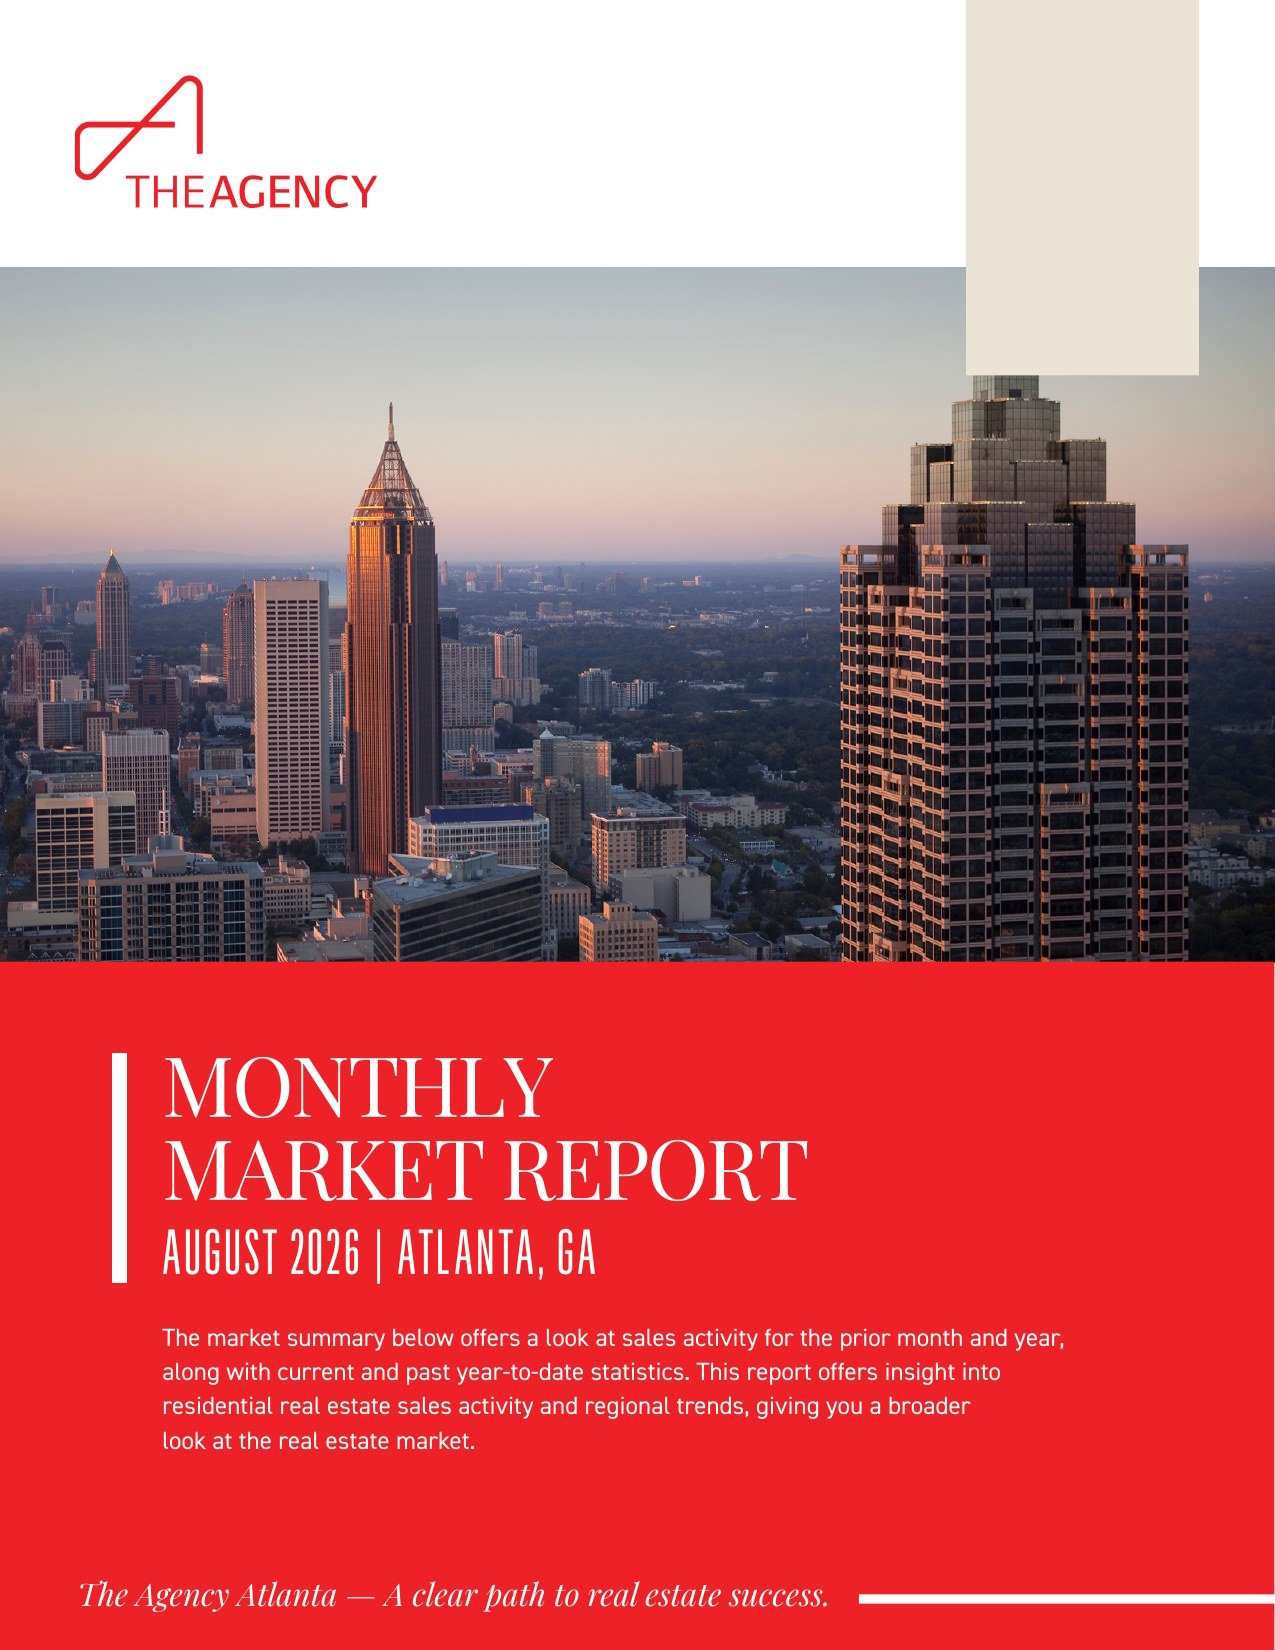
Prices climbed, sales slowed and months of supply expanded for Atlanta single-family homes
The median sold price for single-family homes in the City of Atlanta reached $539,900 in August 2026, up 9.09 percent from $494,900 in August 2025 (FMLS, August 2026). Fewer closings and a deeper supply of homes for sale came with it. This Atlanta real estate market August 2026 update breaks down the key numbers, price band inventory, selling times and what the data means for buyers and sellers.
The figures cover single-family activity across a city that spans parts of Fulton and DeKalb counties. For the prior month, review the Atlanta single-family market report for July 2026. Every statistic below comes from First Multiple Listing Service (FMLS) data, and the outlook is analysis rather than a forecast.
Atlanta Real Estate Market August 2026: What Do the Key Numbers Show?
Atlanta single-family homes sold for a median of $539,900 in August 2026, up 9.09 percent year over year, while median days on market dipped to 28 from 30 (FMLS, August 2026). Sold listings fell 19.15 percent to 439, new listings fell 6.7 percent to 961, and the list to sale price ratio rose to 98.3 percent from 97.9 percent.
Month to Date: August 2026 Compared With August 2025
Metric | August 2026 | August 2025 | Change |
|---|---|---|---|
New Listings | 961 | 1,030 | Down 6.7% |
Sold Listings | 439 | 543 | Down 19.15% |
Median List Price (Solds) | $550,000 | $499,000 | Up 10.22% |
Median Sold Price | $539,900 | $494,900 | Up 9.09% |
Median Days on Market | 28 | 30 | Down 6.67% |
Average List Price (Solds) | $771,047 | $661,210 | Up 16.61% |
Average Sold Price | $753,501 | $645,097 | Up 16.8% |
Average Days on Market | 44 | 50 | Down 12% |
List/Sold Price Ratio | 98.3% | 97.9% | Up 0.49% |
Market data source: FMLS, August 2026. Figures reflect single-family residential activity in the City of Atlanta.
Year to Date: 2026 Compared With 2025
Metric | YTD 2026 | YTD 2025 | Change |
|---|---|---|---|
New Listings | 8,410 | 9,522 | Down 11.68% |
Sold Listings | 4,180 | 4,420 | Down 5.43% |
Median List Price (Solds) | $550,000 | $500,000 | Up 10% |
Median Sold Price | $550,000 | $500,000 | Up 10% |
Median Days on Market | 24 | 26 | Down 7.69% |
Average List Price (Solds) | $785,671 | $719,442 | Up 9.21% |
Average Sold Price | $773,769 | $705,082 | Up 9.74% |
Average Days on Market | 48 | 47 | Up 2.13% |
List/Sold Price Ratio | 98.3% | 98.1% | Up 0.21% |
The year to date view smooths out single month swings: the median sold price is up 10 percent to $550,000, while sold listings are down 5.43 percent (FMLS, August 2026).
How Did Atlanta Home Prices and Selling Times Change in August 2026?
Prices moved higher on both median and average measures in August 2026, and homes generally sold a little faster than a year earlier. The average sold price rose 16.8 percent to $753,501, the median sold price rose 9.09 percent to $539,900, and average days on market fell 12 percent to 44 (FMLS, August 2026).
Median Versus Average Prices
The median sold price marks the midpoint of closed sales and reflects the typical transaction. The average sold price sits well above the median, which indicates that sales in the upper price bands pulled the average higher. The average list price for sold homes followed the same pattern, rising 16.61 percent to $771,047 (FMLS, August 2026).
List to Sale Price Ratio
The list to sale price ratio climbed to 98.3 percent from 97.9 percent in August 2025. Closed sales generally landed near list price, which suggests that homes priced in line with recent sales met buyer expectations.
Days on Market
Year to date, median days on market fell to 24 from 26, while the average edged up 2.13 percent to 48 from 47.
Selling Times by Price Band
FMLS data for August 2026 shows these approximate days on market over the previous 12 months:
- $700K to $1M: about 32 days, the fastest pace
- $1M and above: about 37 days
- $500K to $699K: about 39 days
- $300K to $499K: about 57 days
- $200K to $299K: about 73 days
- $150K to $199K: about 89 days, the slowest pace
How Much Inventory Is Available Across Atlanta Price Bands?
Supply expanded in August 2026. FMLS data for August 2026 shows about 5.6 months of supply, up from about 3.9 earlier in the year, with the $300K to $499K band holding the largest share of active single-family listings at roughly 740 homes. New listings still fell 6.7 percent to 961 for the month.
Active Listings by Price Band
FMLS data for August 2026 shows the following approximate counts of active single-family listings at month end:
- $300K to $499K: about 740 listings, the largest band
- $200K to $299K: about 520 listings
- $1M and above: about 430 listings
- $500K to $699K: about 365 listings
- $700K to $1M: about 265 listings
- $150K to $199K: about 190 listings, the smallest band
Where Inventory Meets Demand
The bands with the most listings are not the fastest movers. The $300K to $499K band holds the most inventory yet has taken roughly 57 days to sell, while the $700K to $1M band carries fewer listings and has moved in about 32 days.
Months Supply of Inventory
Months supply estimates how long current listings would last at the recent pace of sales. The August 2026 reading of about 5.6 months, with a four-month average near 5, sits in a range commonly described as balanced (FMLS, August 2026). That marks a clear shift from about 3.9 months earlier in 2026.
What Does the August 2026 Data Mean for Atlanta Buyers?
Buyers in August 2026 gained more selection and more time to evaluate options, even as prices stayed above last year. Months supply reached about 5.6, sold listings fell 19.15 percent, and the list to sale price ratio of 98.3 percent shows that sellers still achieved close to list price (FMLS, August 2026).
Practical Takeaways for Buyers
- Compare several options in the $300K to $499K band, which holds roughly 740 active homes and has sold in about 57 days.
- Prepare for quicker activity in the $700K to $1M band, where homes have sold in about 32 days over the previous 12 months.
- Pair the 98.3 percent list to sale price ratio with a market analysis of recent comparable sales for each home.
Where Atlanta Homes for Sale Are Located
Atlanta homes for sale span a wide geography. Buckhead runs along Peachtree Road and includes Chastain Park, with access to GA 400 and MARTA rail, while Midtown and Ansley Park border Piedmont Park. Virginia-Highland, Inman Park and Old Fourth Ward sit near the Atlanta BeltLine, Grant Park lies just south of I-20, and West Midtown sits west of Midtown. The Atlanta neighborhood guide covers these areas in more detail.
What Does the August 2026 Data Mean for Atlanta Sellers?
Sellers still benefit from higher prices, but August 2026 rewarded careful pricing and preparation. The median sold price rose 9.09 percent to $539,900 and median days on market fell to 28, yet sold listings dropped 19.15 percent and months supply rose to about 5.6, giving buyers more alternatives (FMLS, August 2026).
Pricing Strategy in a Deeper Market
With more competing listings, accurate list pricing matters. The 98.3 percent list to sale price ratio suggests that homes priced in line with recent comparable sales closed near their asking price. A price opinion built on recent sales in the same band helps position a home against nearby competition.
Seller Considerations by Price Band
- The $700K to $1M and $1M and above bands have sold fastest, so marketing readiness at launch matters.
- The $300K to $499K band carries the largest inventory, so presentation and pricing carry added weight.
- Bands below $300K have taken the longest to sell, so a realistic timeline helps with planning.
What Do the Trends Suggest for the Atlanta Housing Market?
The August 2026 data points to a market moving toward balance while prices hold their annual gains. The year to date median sold price is up 10 percent to $550,000, while rising months supply and slower sales give buyers more room to negotiate (FMLS, August 2026). These signals describe current conditions and are not a forecast of future prices.
Signals Worth Watching
- Months supply: the move from about 3.9 to about 5.6 is the clearest change of 2026.
- Sold listings: August closings fell 19.15 percent, a sharper decline than the 5.43 percent year to date drop.
- New listings: down 11.68 percent year to date, keeping new inventory below 2025 levels.
Regional Context
For statewide context, the Georgia Association of REALTORS publishes Georgia housing market information. Access via I-75, I-85, the I-285 Perimeter, GA 400, MARTA rail and Hartsfield-Jackson Atlanta International Airport remains a common factor when buyers compare Fulton County real estate with DeKalb County real estate.
Frequently Asked Questions About the Atlanta Real Estate Market
The questions below address common buyer and seller concerns about Atlanta single-family homes using FMLS data for August 2026. In short, prices rose, homes sold slightly faster at the median, closings slowed and months supply increased, which together describe a market moving toward balance.
Is Atlanta a buyer's market or a seller's market in August 2026?
FMLS data for August 2026 shows about 5.6 months of supply for single-family homes, a level commonly described as balanced. Earlier in 2026, supply sat near 3.9 months, which leaned more toward sellers. Prices still rose, and the list to sale price ratio reached 98.3 percent. Conditions vary by band, with $700K to $1M homes selling in about 32 days and $150K to $199K homes taking about 89 days.
How much did Atlanta home prices rise in August 2026?
The median sold price for Atlanta single-family homes was $539,900 in August 2026, up 9.09 percent from $494,900 in August 2025 (FMLS, August 2026). The average sold price rose 16.8 percent to $753,501. Year to date, the median sold price reached $550,000, up 10 percent from $500,000. Averages tend to move more than medians because a small number of higher-priced sales can shift them.
How long does it take to sell a house in Atlanta?
Median days on market for Atlanta single-family homes was 28 in August 2026, down from 30 a year earlier, while average days on market was 44, down from 50 (FMLS, August 2026). Timelines differ by price band. Over the previous 12 months, homes from $700K to $1M sold in about 32 days, while homes from $150K to $199K took about 89 days. Condition, pricing and location also influence how quickly an individual home sells.
Why is Atlanta inventory rising if new listings are down?
New listings fell 6.7 percent to 961 in August 2026, yet months supply rose to about 5.6 (FMLS, August 2026). Months supply compares active listings with the pace of sales, and sold listings fell faster, down 19.15 percent to 439. When closings slow more than new listings, supply measured in months increases, which helps explain the broader selection buyers now see.
Key Takeaways From the August 2026 Atlanta Market
Atlanta single-family homes posted higher prices in August 2026, with a $539,900 median sold price, up 9.09 percent (FMLS, August 2026). At the same time, sold listings fell 19.15 percent and months supply rose to about 5.6, giving buyers more choice. Faster selling times in the $700K to $1M and $1M and above bands contrast with longer timelines in the lower bands.
For a price opinion or a tailored home search based on these trends, connect with an agent at The Agency Atlanta.