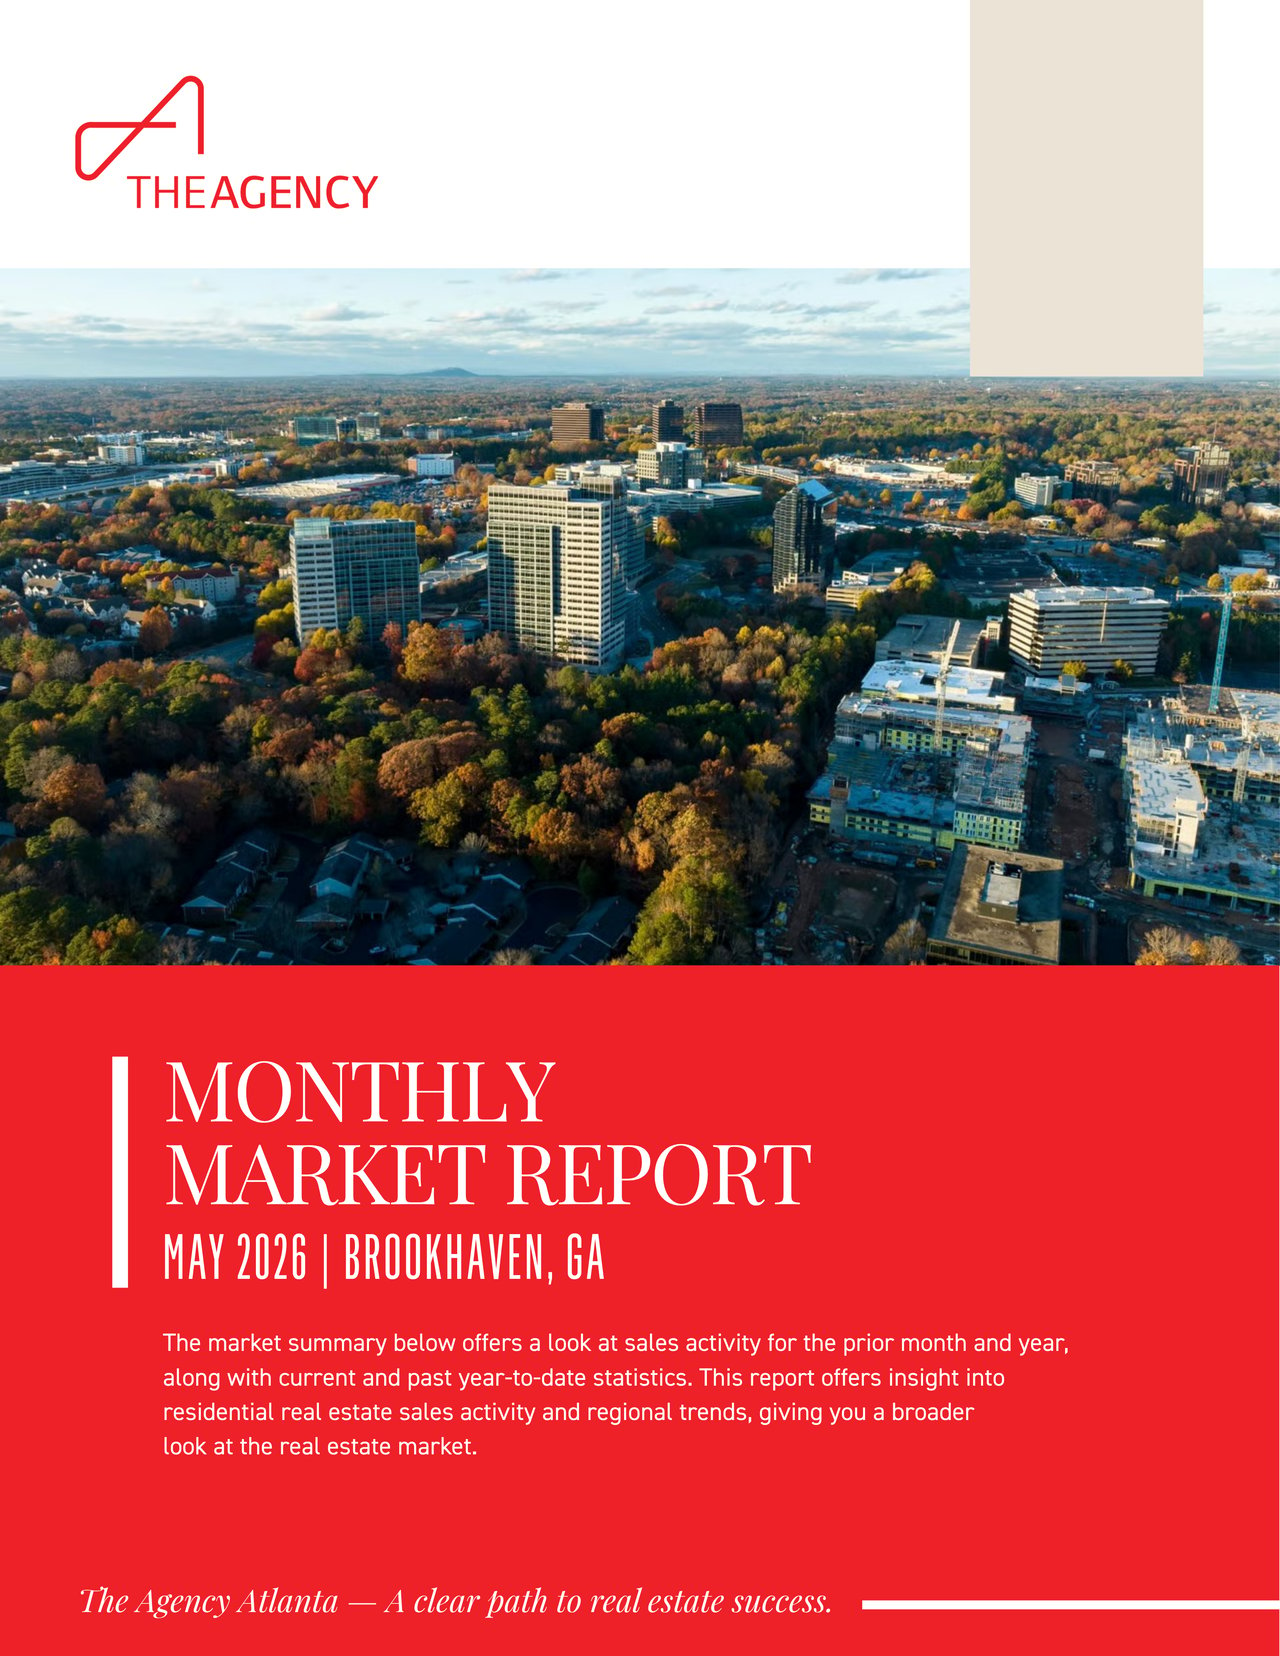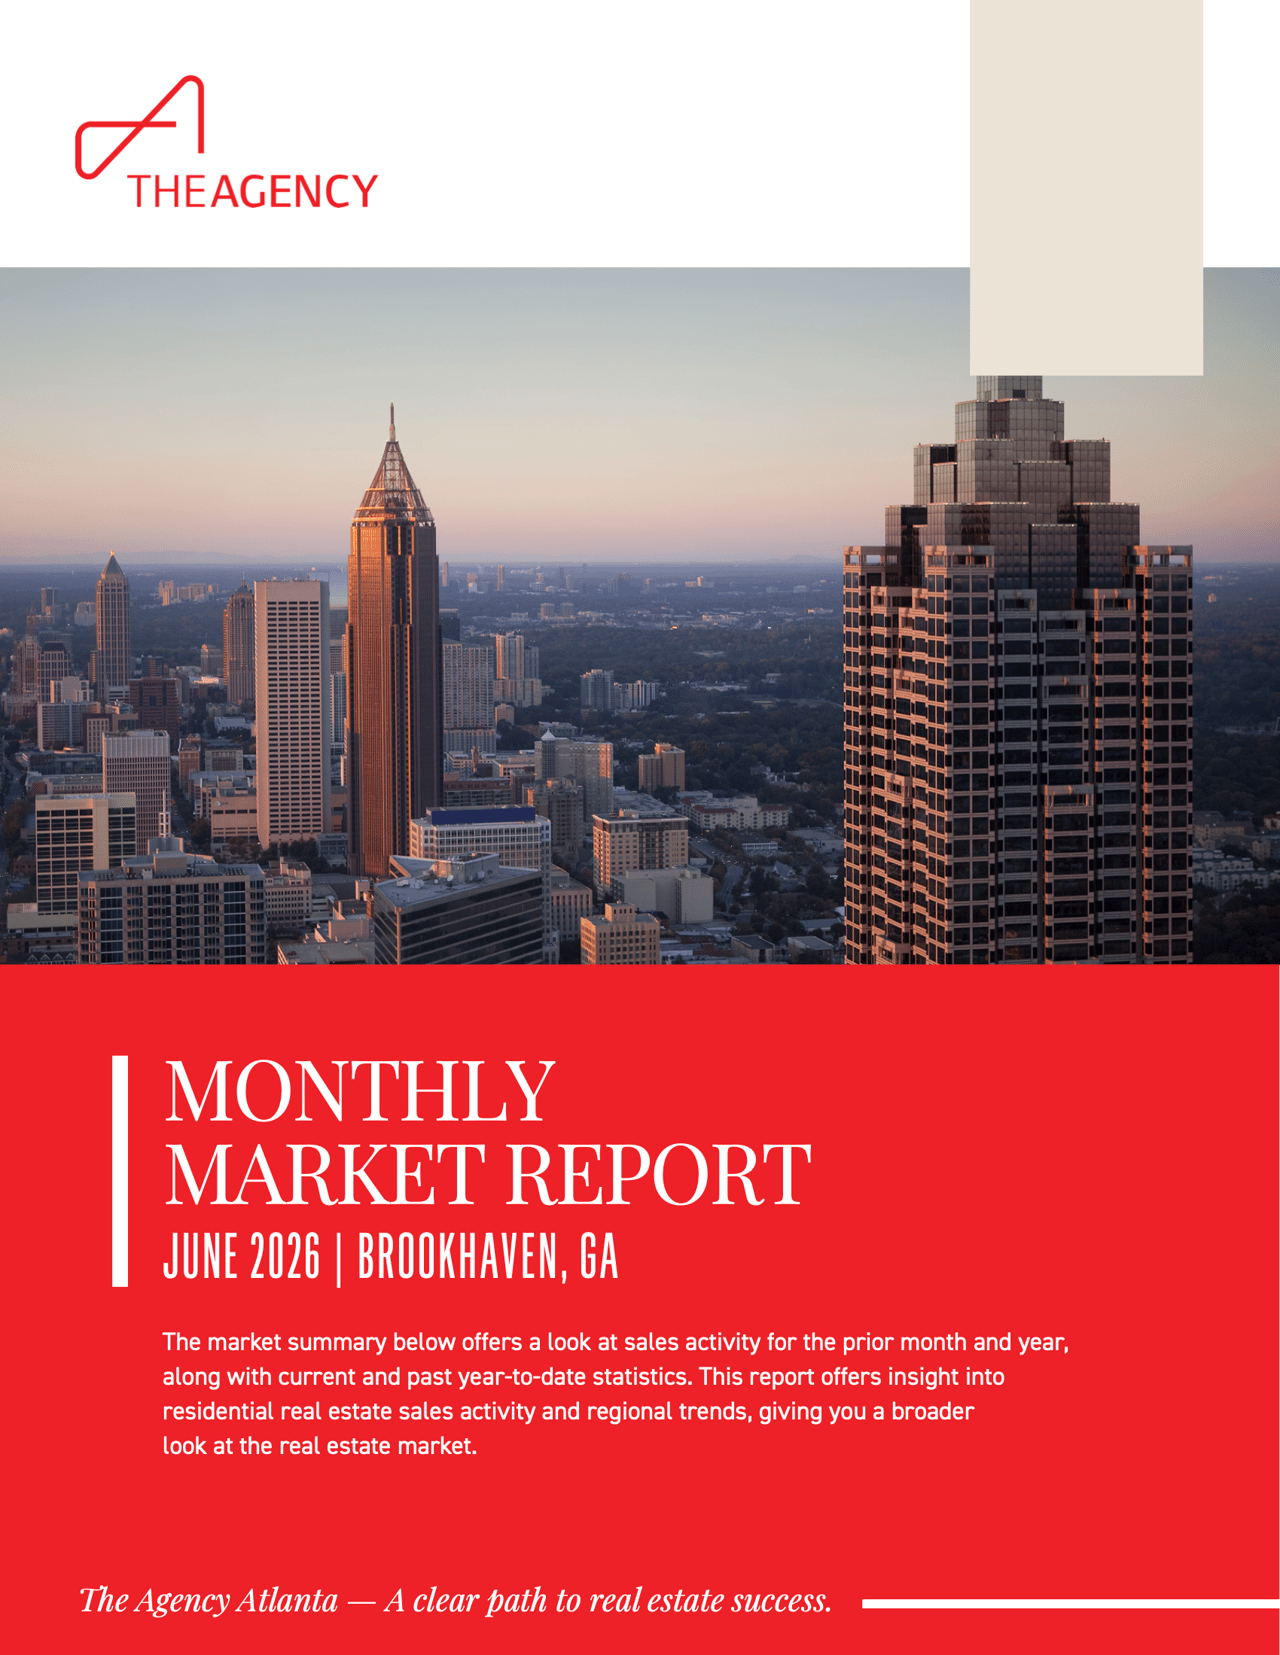
Brookhaven, Georgia entered mid-2026 with a single family market that told two stories at once. Month-over-month activity cooled compared to June 2025, with fewer new listings and fewer closings, while year-to-date pricing continued to climb on a comparative basis. Homes that did sell moved quickly and closed very close to asking price, a signal that well-prepared listings still met motivated buyers. This June 2026 update breaks down the numbers from The Agency Atlanta Monthly Market Report so you can see exactly how the single family segment performed, what shifted from last year, and how the condo segment compared over the same window.
How did Brookhaven single family home prices perform in June 2026?
Brookhaven single family prices were mixed on a month-over-month basis but firmly positive year to date. The median sold price for June 2026 was $922,500, down 2.38 percent from $945,000 in June 2025. On a year-to-date basis, however, the median sold price reached $989,500, up 8.44 percent over the same period in 2025. Average pricing followed a similar upward yearly trend, indicating steady demand across the segment.
The table below summarizes the core single family pricing and activity figures from the June 2026 report.
Metric (Single Family) | June 2026 | June 2025 | Change |
|---|---|---|---|
New Listings | 38 | 51 | -25.49% |
Sold Listings | 30 | 44 | -31.82% |
Median Sold Price | $922,500 | $945,000 | -2.38% |
Average Sold Price | $1,190,768 | $1,158,340 | 2.8% |
Median Days on Market | 14 | 21 | -33.33% |
Average Days on Market | 23 | 30 | -23.33% |
List to Sold Price Ratio | 99.7% | 98% | 1.68% |
Source: The Agency Atlanta Monthly Market Report, Brookhaven, GA Single Family, June 2026.
What happened with inventory and new listings?
Supply tightened noticeably in June 2026. New single family listings totaled 38, down 25.49 percent from 51 in June 2025. Sold listings came in at 30, down 31.82 percent from 44 a year earlier. On a year-to-date basis, new listings reached 223 compared to 308 in the prior year, a decline of 27.6 percent, while year-to-date sold listings totaled 130 versus 150, down 13.33 percent.
Fewer homes coming to market and fewer closings often reflect a more selective environment on both sides of the transaction. For buyers, this can mean a narrower pool of options at any given time. For sellers, it can mean less competition from comparable listings. The report also tracks properties for sale by price range and months of supply of inventory, which are useful gauges of how quickly available homes could sell at the current pace.
How fast were Brookhaven homes selling?
Pace picked up meaningfully year over year. Median days on market for single family homes fell to 14 in June 2026 from 21 in June 2025, a decline of 33.33 percent. Average days on market dropped to 23 from 30, down 23.33 percent. Year to date, median days on market reached 10 compared to 16 the year prior, and average days on market was 28 versus 32. Homes that were priced and presented well tended to find buyers efficiently during this window.
Did sellers get close to their asking prices?
Yes. The list to sold price ratio for single family homes was 99.7 percent in June 2026, up from 98 percent in June 2025. On a year-to-date basis, the ratio was 99.5 percent compared to 98.7 percent. A ratio near 100 percent indicates that final sale prices landed very close to the most recent list prices, which reflects realistic pricing and steady buyer follow-through across the segment.
How did the Brookhaven condo segment compare?
The condo segment moved in a different direction than single family on price. In June 2026, condo sold listings rose to 15 from 13 in June 2025, up 15.38 percent, even as year-to-date condo sold listings declined to 55 from 68. The median sold price for condos climbed to $550,000 in June 2026 from $505,000 a year earlier, an increase of 8.91 percent, and year-to-date median condo pricing reached $650,000 versus $508,000. Condos tended to take longer to sell than single family homes, with median days on market at 28 for June 2026.
Metric (Condo) | June 2026 | June 2025 | Change |
|---|---|---|---|
New Listings | 20 | 22 | -9.09% |
Sold Listings | 15 | 13 | 15.38% |
Median Sold Price | $550,000 | $505,000 | 8.91% |
Average Sold Price | $641,169 | $518,086 | 23.76% |
Median Days on Market | 28 | 35 | -20% |
List to Sold Price Ratio | 98% | 98.5% | -0.47% |
Source: The Agency Atlanta Monthly Market Report, Brookhaven, GA Condo, June 2026.
What do these Brookhaven trends mean for buyers and sellers?
Taken together, the June 2026 numbers describe a Brookhaven single family market with limited supply, quick sale timelines, and final prices very close to asking. Sellers who prepare their homes and price them to current data have historically benefited from these conditions, as reflected in the near 100 percent list to sold price ratio. Buyers face a smaller selection and should be ready to act on well-priced listings, since median days on market shortened compared to last year.
- Sellers: Strong list to sold ratios and shorter days on market suggest that accurate, data-informed pricing supported efficient sales.
- Buyers: Reduced new listings and sold volume point to a tighter pool of homes, making preparation and quick decision-making valuable.
- Condo shoppers: Condo median pricing rose year over year, and timelines ran longer than single family, which can create more room for negotiation on individual listings.
What should you watch heading into the second half of 2026?
Year-to-date figures add helpful context to the single month snapshot. Through June 2026, Brookhaven recorded 130 single family closings compared to 150 in the same period of 2025, a decline of 13.33 percent, while the year-to-date median sold price rose to $989,500 from $912,500. The average sold price year to date reached $1,209,700, up 7.56 percent from $1,124,711. Even as transaction counts eased, the prices buyers agreed to pay continued trending higher across the segment.
A few figures from the report are worth tracking in the coming months. Months supply of inventory and the count of properties for sale by price range indicate how much choice buyers have at different price points, and they can shift quickly when new listings slow. The gap between average list price and average sold price is another useful signal, since the single family list to sold ratio held near 99.7 percent in June. Watching whether new listings recover toward prior-year levels, whether days on market stays compressed, and how condo timelines compare to single family will help both buyers and sellers gauge momentum. Reviewing each new monthly report against these same measures is the most reliable way to separate a short-term fluctuation from a sustained trend, and it keeps decisions grounded in local Brookhaven data rather than broad national headlines.
It also helps to view these results alongside the number of properties for sale by price range and the average list and sold price per square foot that the report tracks, since those measures show where activity is concentrated within the market. Buyers weighing timing and sellers preparing a listing can both use these benchmarks to set expectations, structure offers, and decide when to bring a property to market. Because a single month can be shaped by the particular mix of homes that happened to close, pairing the June 2026 single family and condo figures with the year-to-date columns gives a steadier read on direction before making a move.
Frequently asked questions about the Brookhaven market
What was the median single family sold price in Brookhaven in June 2026?
The median single family sold price was $922,500 in June 2026, down 2.38 percent from $945,000 in June 2025. Year to date, the median sold price was $989,500, up 8.44 percent over the prior year.
How long did homes take to sell?
Single family homes had a median of 14 days on market in June 2026, down from 21 a year earlier. The average was 23 days, compared to 30 in June 2025.
Were sellers accepting big discounts off list price?
No. The single family list to sold price ratio was 99.7 percent, meaning final prices landed very close to the most recent list prices.
How did condos differ from single family homes?
Condo sold volume rose 15.38 percent year over year and median condo pricing increased 8.91 percent to $550,000, while condos generally took longer to sell than single family homes.
Conclusion
Brookhaven's June 2026 single family market combined tighter supply with efficient sale timelines and final prices close to asking, while year-to-date pricing stayed ahead of last year. The condo segment showed rising median prices and slightly longer selling periods, offering a different set of considerations for buyers and sellers. Every home and neighborhood within Brookhaven can behave differently from the citywide averages, so a tailored review of comparable listings and recent closings for your specific price range and property type is the best next step. Connect with The Agency Atlanta today for a personalized Brookhaven market consultation and a data-driven strategy tailored to your goals.
All figures are sourced from The Agency Atlanta Monthly Market Report for Brookhaven, GA, June 2026. Market data reflects reported activity for the periods noted and is provided for general informational purposes.