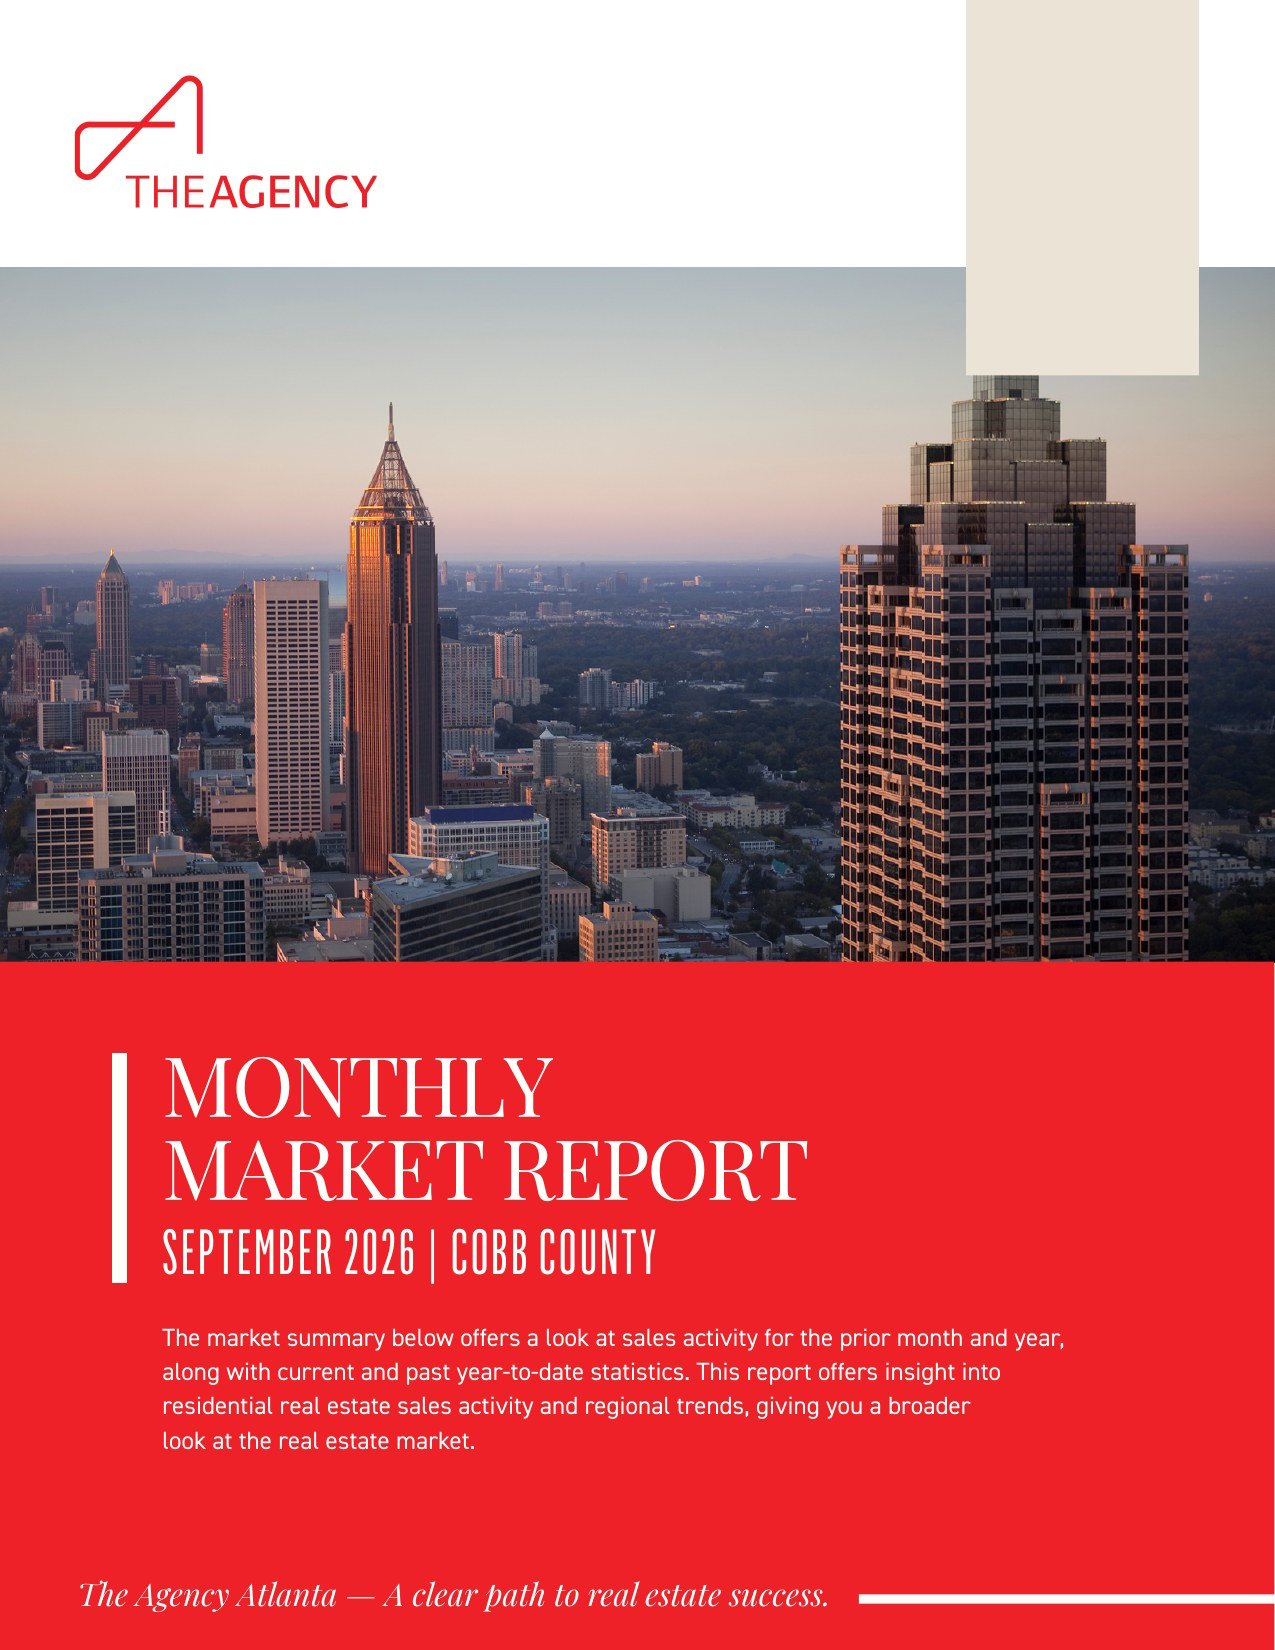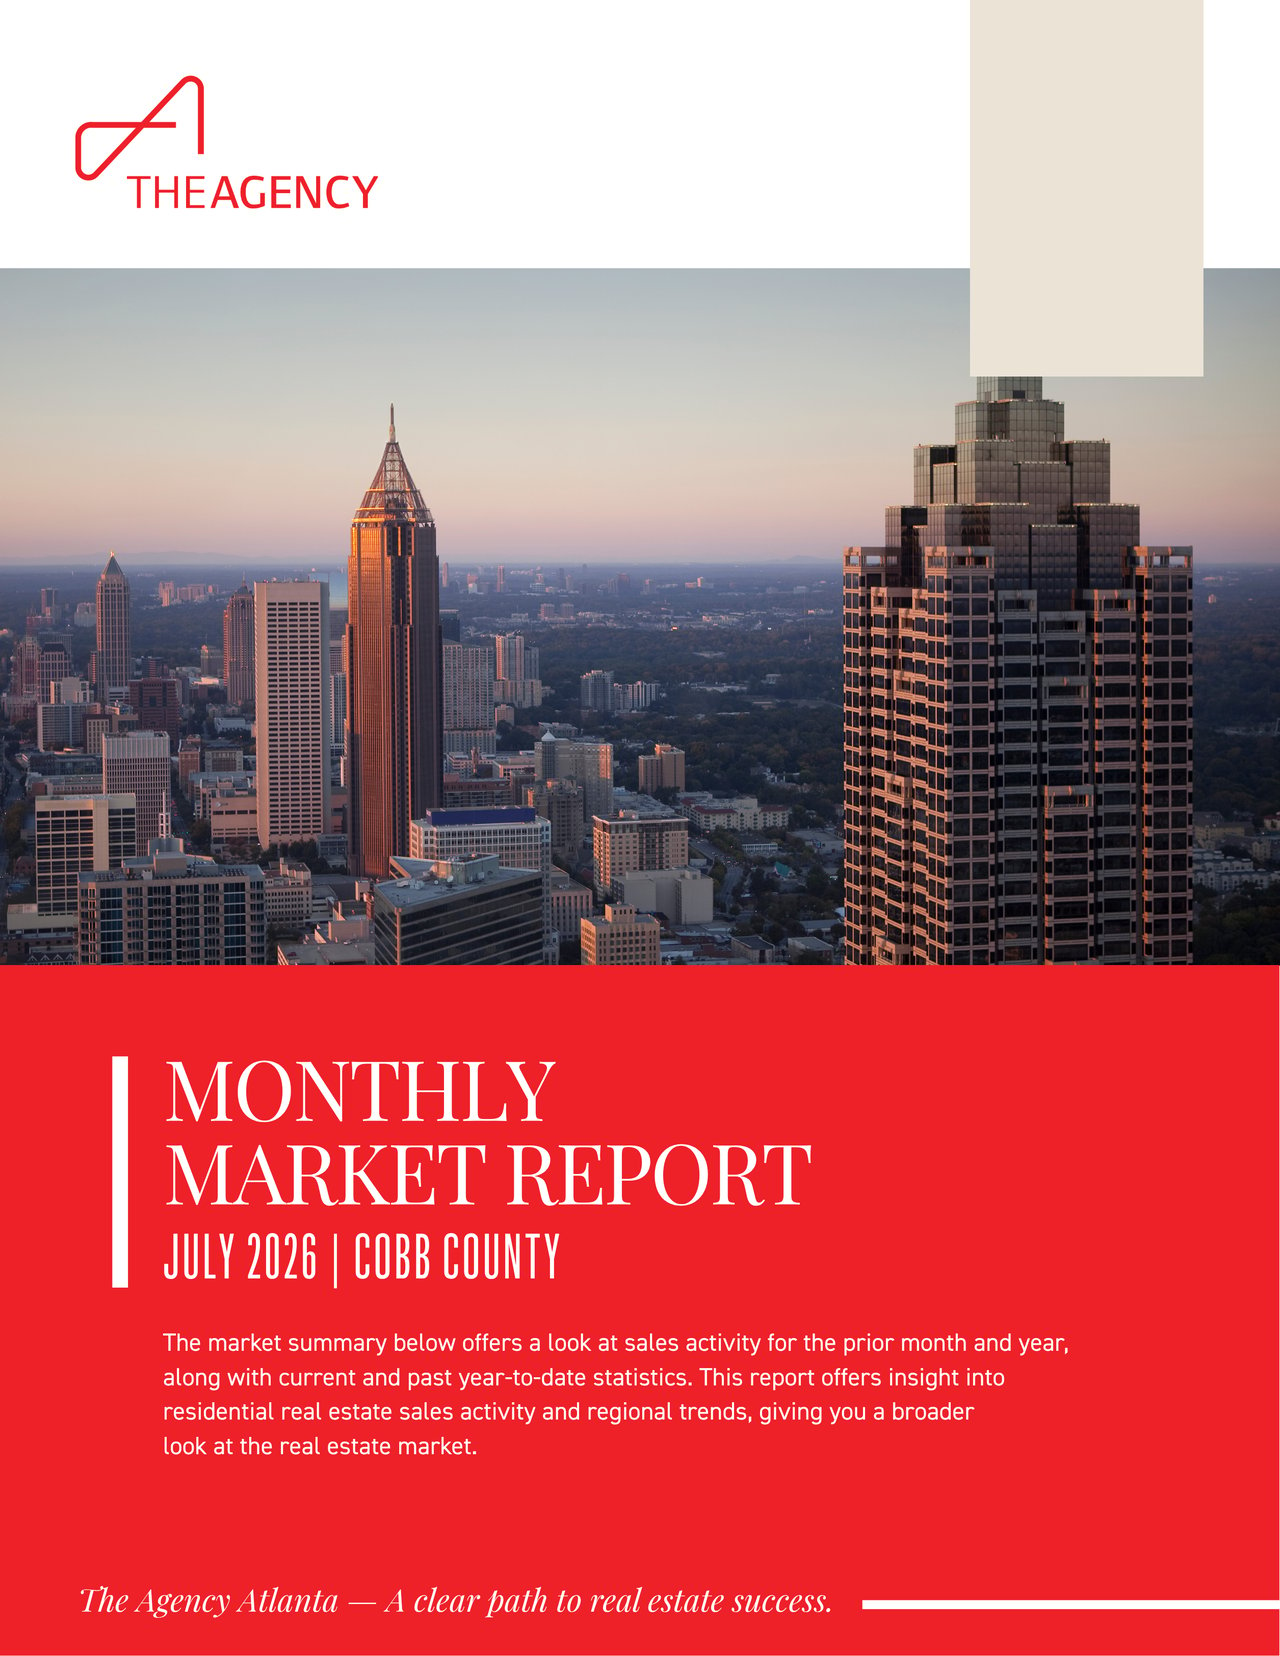
The Cobb County real estate market July 2026 delivered a clear signal for single family buyers and sellers: homes sold in a median of 21 days while the median sold price settled at $494,250 (FMLS, July 2026). That combination of quick sales and a modest year-over-year price adjustment sets the tone for the month. Cobb County remains one of metro Atlanta's most active single family submarkets, stretching from Vinings and Smyrna near the Chattahoochee River up through Marietta, Kennesaw, and Acworth. This report breaks down the numbers behind Cobb County single family activity in July 2026, what they mean for buyers, what they mean for sellers, and how the year-to-date trends compare with 2025. Every figure below is sourced to FMLS for July 2026, and each section opens with a direct answer so you can find what matters fastest.
What are the key numbers in the Cobb County real estate market for July 2026?
In July 2026, Cobb County single family homes posted a median sold price of $494,250, down 4.03 percent from $515,000 a year earlier (FMLS, July 2026). Sold listings totaled 610, new listings reached 1,084, and the median days on market held at 21. The list to sold price ratio came in at 98.7 percent, signaling sellers still captured close to asking. The average sold price told a slightly different story, rising 1.31 percent year over year to $579,693, which reflects the mix of higher-priced homes that traded during the month.
Month to date snapshot
Metric | July 2026 | July 2025 | % Change |
|---|---|---|---|
New Listings | 1,084 | 1,017 | 6.59 |
Sold Listings | 610 | 654 | -6.73 |
Median List Price (Solds) | $499,000 | $519,000 | -3.85 |
Median Sold Price | $494,250 | $515,000 | -4.03 |
Median Days on Market | 21 | 22 | -4.55 |
Average List Price (Solds) | $589,988 | $581,872 | 1.39 |
Average Sold Price | $579,693 | $572,204 | 1.31 |
Average Days on Market | 33 | 34 | -2.94 |
List/Sold Price Ratio | 98.7% | 98.4% | 0.34 |
Year to date snapshot
Metric | YTD 2026 | YTD 2025 | % Change |
|---|---|---|---|
New Listings | 7,449 | 7,060 | 5.51 |
Sold Listings | 4,289 | 4,140 | 3.6 |
Median List Price (Solds) | $485,000 | $485,000 | 0 |
Median Sold Price | $478,500 | $480,000 | -0.31 |
Median Days on Market | 22 | 19 | 15.79 |
Average List Price (Solds) | $578,024 | $579,113 | -0.19 |
Average Sold Price | $568,612 | $571,086 | -0.43 |
Average Days on Market | 41 | 36 | 13.89 |
List/Sold Price Ratio | 98.5% | 98.7% | -0.21 |
Market data source: FMLS, July 2026. Figures reflect single family residential activity in Cobb County.
Inventory and days on market context
New listings rose 6.59 percent year over year in July 2026, while sold listings eased 6.73 percent (FMLS, July 2026). Year to date, both new listings (up 5.51 percent) and sold listings (up 3.6 percent) ran ahead of 2025. Median days on market lengthened year to date to 22 from 19, and average days on market moved to 41 from 36 (FMLS, July 2026). The gap between the monthly median of 21 days and the year to date average of 41 days shows how pace varies through the calendar and across price points. Taken together, more homes coming to market alongside a slightly slower average pace points to a market adding supply without losing momentum on well-prepared listings.
What does the July 2026 data mean for Cobb County home buyers?
For buyers, July 2026 offered a slightly friendlier entry point than a year earlier. The median sold price fell 4.03 percent to $494,250, and median list price on solds dropped 3.85 percent to $499,000 (FMLS, July 2026). With new listings up 6.59 percent year over year, buyers saw more choices while homes still moved in a median of 21 days.
How buyers can use these numbers
- Wider selection: 1,084 new single family listings entered the market in July 2026, a 6.59 percent gain over July 2025 (FMLS, July 2026).
- Steady pace: with a median 21 days on market, well-prepared buyers who tour Cobb County neighborhoods such as East Cobb, Vinings, and Kennesaw should be ready to act.
- Room to negotiate: the 98.7 percent list to sold ratio shows buyers generally closed just under asking (FMLS, July 2026).
Access matters in Cobb County, where commuters lean on Interstate 75, Interstate 285, and U.S. 41 (Cobb Parkway) to reach Midtown Atlanta and Hartsfield-Jackson, and lifestyle draws include the Chattahoochee River corridor, Kennesaw Mountain, the Marietta Square, and Truist Park in the Battery. Buyers who get pre-qualified early and monitor new listings weekly are best positioned to move when the right home appears.
What does the July 2026 data mean for Cobb County home sellers?
Sellers remained in a strong position in July 2026. The list to sold price ratio held at 98.7 percent, and average sold price rose 1.31 percent year over year to $579,693 (FMLS, July 2026). Homes still sold quickly at a median 21 days on market, though sold listings dipped 6.73 percent, a reminder that accurate pricing drives results.
Seller takeaways for July 2026
- Price to the data: median sold price landed at $494,250, so a market analysis grounded in recent Cobb County comparables supports realistic list pricing (FMLS, July 2026).
- Presentation pays: with average days on market at 33, staging and preparation help homes stand out.
- Expect close-to-asking offers: the 98.7 percent ratio suggests well-priced homes captured near-list results.
Because sold volume eased year over year while new listings grew, sellers who study current Cobb County inventory in their price band can position more competitively and avoid price reductions later in the listing period. A pricing strategy anchored to the most recent comparable sales, rather than last spring's peak, tends to shorten time on market.
What do the July 2026 trends suggest for the rest of the year?
The July 2026 data points to a market that is normalizing rather than swinging sharply. Median sold price eased 4.03 percent year over year for the month, yet year to date median sold price is nearly flat at $478,500, down just 0.31 percent (FMLS, July 2026). Rising inventory and slightly longer days on market suggest a gradual move toward balance. This is analysis of reported trends, not a prediction or guarantee of future results.
Signals worth watching
- Inventory momentum: new listings up 5.51 percent year to date could keep giving buyers more options (FMLS, July 2026).
- Time on market: year to date median days on market rose to 22 from 19, worth tracking in coming reports.
- Price stability: a nearly flat year to date median sold price signals steadiness rather than rapid change.
Frequently asked questions about the Cobb County market
Is July 2026 a buyer or seller market in Cobb County?
The July 2026 figures show characteristics of both sides. Sellers benefited from a 98.7 percent list to sold price ratio and a quick median 21 days on market, while buyers gained from a 4.03 percent year over year dip in median sold price and a 6.59 percent rise in new listings (FMLS, July 2026). Rather than labeling the market, use the specific numbers for your price range and neighborhood, and consult a local agent for a tailored market analysis.
How much did Cobb County single family home prices change in July 2026?
In July 2026, the median sold price for Cobb County single family homes was $494,250, down 4.03 percent from $515,000 in July 2025 (FMLS, July 2026). The average sold price moved the other direction, rising 1.31 percent to $579,693. Year to date, the median sold price of $478,500 was essentially flat versus 2025, a decline of 0.31 percent, showing overall price stability across the first seven months of the year.
How fast are homes selling in Cobb County?
Single family homes in Cobb County sold in a median of 21 days in July 2026, down slightly from 22 days in July 2025 (FMLS, July 2026). The average days on market was 33. Year to date, homes took a bit longer, with median days on market at 22 compared with 19 in 2025. Speed still varies by price point and neighborhood, so reviewing recent comparable sales is the best guide for your situation.
How many homes sold in Cobb County in July 2026?
There were 610 single family homes sold in Cobb County in July 2026, a 6.73 percent decrease from 654 in July 2025 (FMLS, July 2026). At the same time, 1,084 new listings came to market, up 6.59 percent year over year. Year to date, sold listings reached 4,289, a 3.6 percent increase over the same period in 2025, indicating steady overall transaction volume.
Are sellers still getting close to their asking price in Cobb County?
Yes. In July 2026, Cobb County single family sellers received 98.7 percent of their final list price on average, up slightly from 98.4 percent a year earlier (FMLS, July 2026). Year to date, the ratio was 98.5 percent. That consistency indicates that homes priced in line with recent comparable sales continued to attract offers near asking, while overpriced listings were more likely to see reductions.
Cobb County July 2026: key takeaways and next steps
Three points define the Cobb County real estate market for July 2026. First, prices held broadly steady, with a monthly median sold price of $494,250 and a nearly flat year to date median of $478,500 (FMLS, July 2026). Second, homes sold quickly at a median 21 days, and sellers captured 98.7 percent of list. Third, rising inventory gave buyers more choices without disrupting the pace of sales. For deeper context, compare these figures with our earlier Cobb County market reports, explore our East Cobb neighborhood guide, or browse current Cobb County homes for sale. You can also review the underlying data at FMLS and the Atlanta Regional Commission. Ready for a personalized market analysis? Schedule a consultation with a Cobb County agent at The Agency Atlanta today.