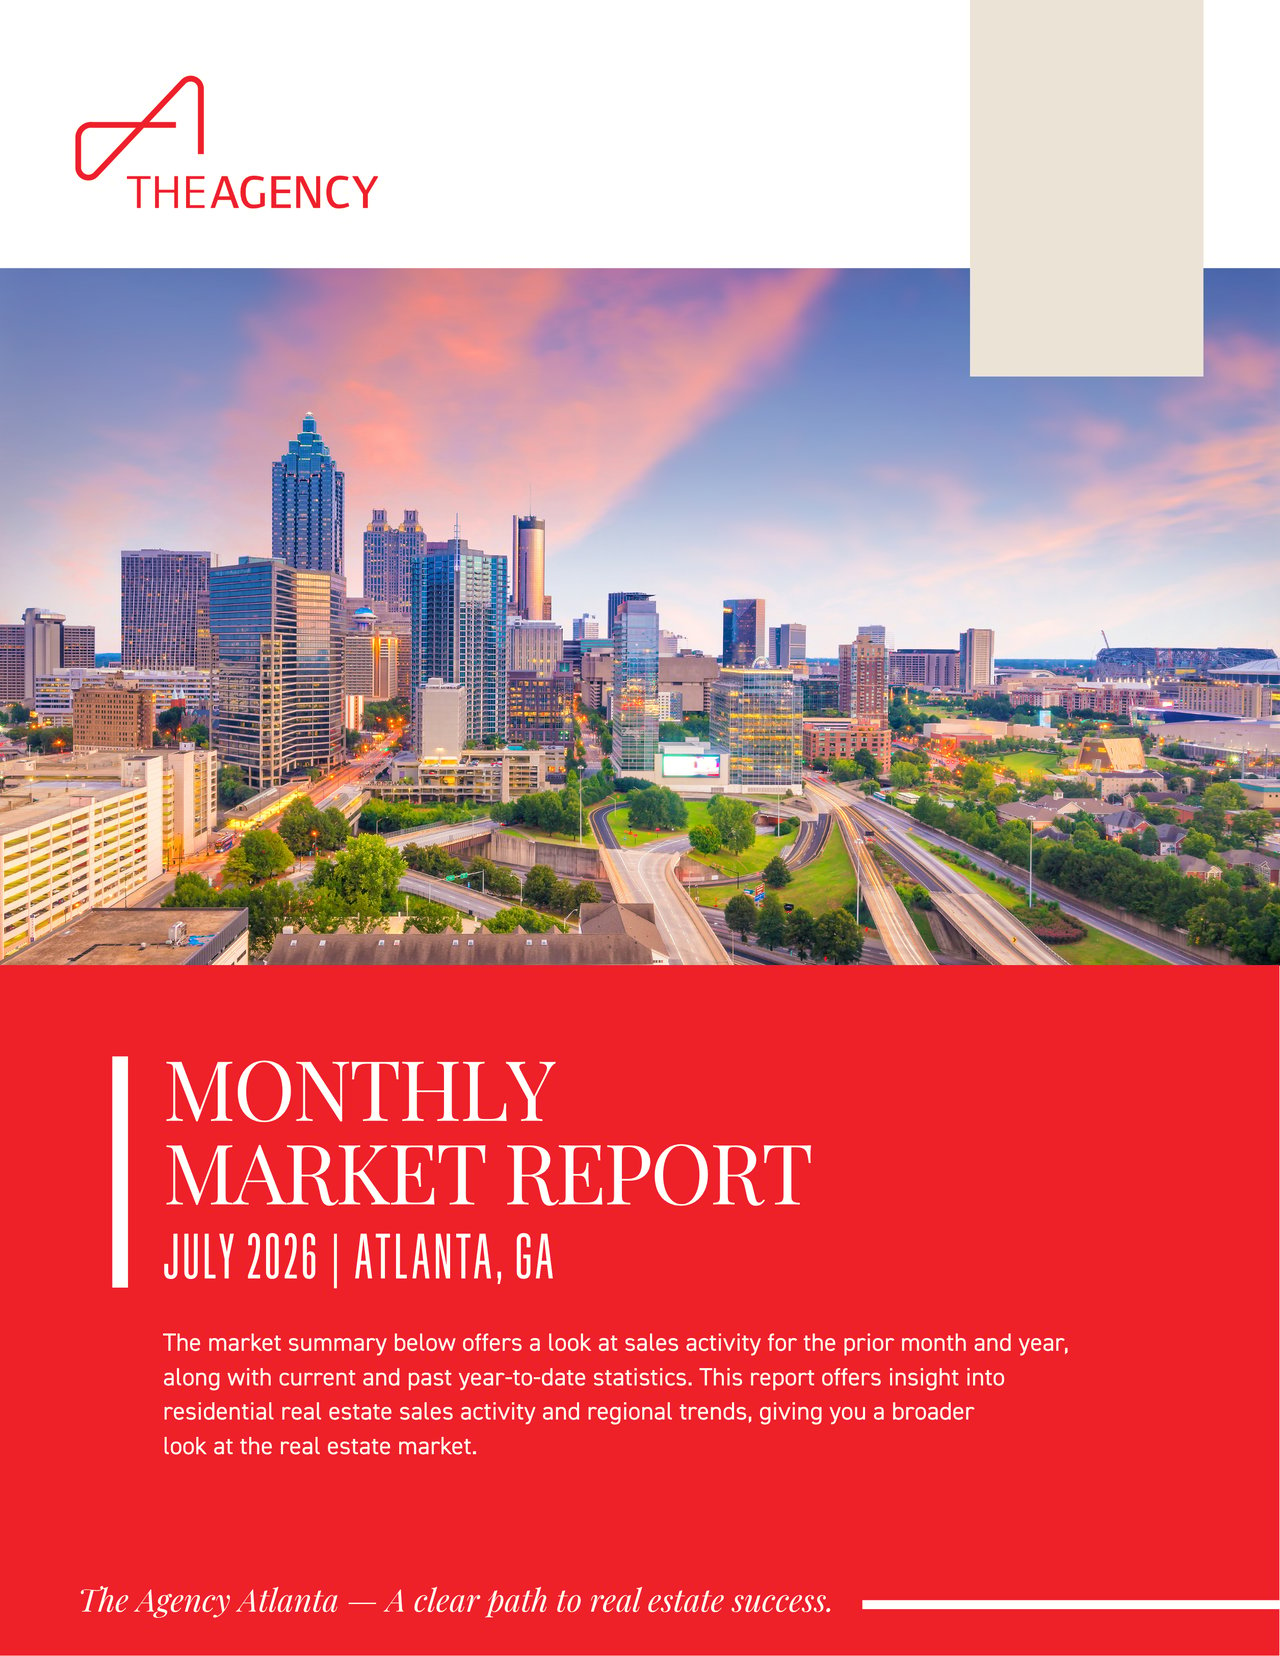
A data-driven look at Atlanta single-family prices, inventory, and days on market.
The Atlanta real estate market July 2026 posted a median single-family sold price of $590,000, a 24.22 percent jump over the $474,950 recorded a year earlier (FMLS, July 2026). At the same time, closed sales fell to 472 from 598, a 21.07 percent decline. That combination of stronger pricing and fewer transactions is the story for anyone tracking single-family homes across the city, from Grant Park and Kirkwood to Buckhead and the corridors along Peachtree Street and Interstate 85. This report breaks down what sellers listed, what buyers paid, and how quickly homes moved. You will find the key numbers, what they mean for buyers and sellers, and an objective read on where the data points, all sourced to FMLS for July 2026.
What are the key numbers for the Atlanta real estate market in July 2026?
In July 2026, Atlanta single-family homes posted a median sold price of $590,000, up 24.22 percent from $474,950 a year earlier, while the average sold price rose 19.04 percent to $802,336 (FMLS, July 2026). Homes sold in a median of 28 days, and sellers captured 98.4 percent of list price. New listings and closed sales both fell year over year.
Month-to-date snapshot
Metric | July 2026 | July 2025 | % Change |
|---|---|---|---|
New Listings | 1,019 | 1,172 | -13.05% |
Sold Listings | 472 | 598 | -21.07% |
Median List Price (Solds) | $599,900 | $492,180 | +21.89% |
Median Sold Price | $590,000 | $474,950 | +24.22% |
Median Days on Market | 28 | 30 | -6.67% |
Average List Price (Solds) | $817,049 | $692,063 | +18.06% |
Average Sold Price | $802,336 | $674,018 | +19.04% |
Average Days on Market | 49 | 48 | +2.08% |
List/Sold Price Ratio | 98.4% | 97.3% | +1.09 |
Market data source: FMLS, July 2026. Figures reflect Single Family residential activity in Atlanta, Georgia.
Year-to-date context
Through July 2026, Atlanta recorded 7,487 new single-family listings versus 8,491 a year earlier (-11.82 percent), with 3,685 closed sales against 3,867 (-4.71 percent). The year-to-date median sold price reached $550,000, up 10 percent from $500,000, while the average sold price rose 7.99 percent to $772,216 (FMLS, July 2026).
Metric | YTD 2026 | YTD 2025 | % Change |
|---|---|---|---|
New Listings | 7,487 | 8,491 | -11.82% |
Sold Listings | 3,685 | 3,867 | -4.71% |
Median List Price (Solds) | $550,000 | $500,000 | +10% |
Median Sold Price | $550,000 | $500,000 | +10% |
Median Days on Market | 23 | 25 | -8% |
Average List Price (Solds) | $783,241 | $729,430 | +7.38% |
Average Sold Price | $772,216 | $715,114 | +7.99% |
Average Days on Market | 49 | 47 | +4.26% |
List/Sold Price Ratio | 98.3% | 98.1% | +0.19 |
What does the July 2026 data mean for Atlanta home buyers?
For buyers, July 2026 meant higher prices and less new supply. New single-family listings fell 13.05 percent year over year to 1,019, and the median sold price climbed to $590,000 (FMLS, July 2026). Homes moved in a median of 28 days, and sellers captured 98.4 percent of list price, so well-priced homes drew firm offers.
- Fewer new options: New listings dropped to 1,019 in July 2026 from 1,172 a year earlier (FMLS, July 2026).
- Higher median pricing: The median sold price of $590,000 rose 24.22 percent year over year.
- Close-to-asking offers: A 98.4 percent list-to-sold ratio means final prices landed near asking.
Where buyers are focusing
Atlanta draws commuters and professionals who value access to Interstate 75, Interstate 85, and MARTA rail, plus walkable districts like the Atlanta BeltLine, Ponce City Market, and Piedmont Park. Buyers weighing the difference between the median and average sold price should note the gap: the average of $802,336 reflects activity in higher price bands, while the median of $590,000 sits closer to the typical transaction (FMLS, July 2026).
What does the July 2026 data mean for Atlanta home sellers?
Sellers in Atlanta held strong pricing power in July 2026. The list-to-sold price ratio rose to 98.4 percent from 97.3 percent a year earlier, and the median days on market shortened to 28 from 30 (FMLS, July 2026). With new listings down 13.05 percent, well-prepared homes faced less competition, though the sharp drop in closed sales points to more selective buyers.
What sellers should watch
- Stronger list-to-sold ratio: Sellers captured 98.4 percent of asking in July 2026, up from 97.3 percent.
- Pricing precision: With average days on market at 49, homes priced beyond the market read can linger.
- Fewer transactions: Closed sales fell 21.07 percent year over year, so accurate pricing and strong presentation matter more.
A current market analysis, rather than a rule of thumb, helps sellers position across neighborhoods like Grant Park, West End, and Buckhead where buyer demand and price expectations vary by segment.
How do inventory and days on market break down across price ranges?
Atlanta's July 2026 report tracks active inventory and days on market by price range, along with months supply of inventory and price per square foot (FMLS, July 2026). These segment-level readings help explain why the median and average diverge and where homes are moving quickest across the single-family market.
Inventory and months supply
Reading the supply signal
The report presents months supply of inventory and the count of active single-family listings by price band as of the end of July 2026. Buyers and sellers can use these bands to gauge competition at their target price point (FMLS, July 2026).
Days on market and price per square foot
Segment pace
Average days on market by price range and average list and sale price per square foot are charted across price bands in the July 2026 report, showing how pace and per-foot pricing shift between lower and higher segments (FMLS, July 2026).
What do the July 2026 trends suggest for the Atlanta market?
The July 2026 data suggests an Atlanta single-family market with firmer pricing and thinner supply. New listings fell 13.05 percent year over year and closed sales dropped 21.07 percent, yet the median sold price rose 24.22 percent and the list-to-sold ratio improved to 98.4 percent (FMLS, July 2026). Read as analysis rather than prediction, these figures point to constrained inventory meeting selective demand.
- Year-to-date median sold price rose 10 percent to $550,000, signaling durable pricing (FMLS, July 2026).
- Both new listings and closed sales declined year to date, a broad pullback in transaction volume.
- The improved list-to-sold ratio suggests sellers held pricing power despite fewer sales.
None of this constitutes a forecast or a guarantee. It is an objective read of the reported figures for the period.
Frequently asked questions about the Atlanta real estate market
Is now a good time to buy a single-family home in Atlanta?
Buyers in July 2026 faced fewer new listings, down 13.05 percent to 1,019, and higher prices, with a median sold price of $590,000 (FMLS, July 2026). Homes sold in a median of 28 days. Whether the timing fits depends on your budget, target neighborhood, and financing. Because the list-to-sold ratio was 98.4 percent, buyers should expect to negotiate close to asking on well-priced homes. A conversation with a local agent about your specific price band is the best next step.
How much are homes selling for in Atlanta?
In July 2026, the median single-family sold price in Atlanta was $590,000, while the average sold price was $802,336 (FMLS, July 2026). Year to date, the median sold price reached $550,000, up 10 percent from the prior year. The gap between median and average reflects sales activity across a range of price bands, with higher-priced homes pulling the average upward. Your home's likely price depends on size, condition, location, and current comparable sales, which a market analysis can clarify.
How fast are homes selling in Atlanta?
Single-family homes in Atlanta sold in a median of 28 days in July 2026, down from 30 days a year earlier, with an average of 49 days on market (FMLS, July 2026). Year to date, the median stood at 23 days. Pace varies by price range and property condition, so accurately priced and well-presented homes typically move faster than the averages suggest.
Is Atlanta a buyer's or seller's market right now?
The July 2026 figures show characteristics of a market favorable to sellers, with a 98.4 percent list-to-sold ratio and a 28-day median days on market (FMLS, July 2026). New listings and closed sales both declined year over year, tightening supply. The months supply of inventory reading in the report is the clearest single indicator; reviewing it with an agent for your target price band gives the most accurate answer.
Atlanta market takeaways and next steps
The Atlanta single-family market in July 2026 combined firmer pricing with lower supply and fewer sales. Three takeaways stand out: the median sold price rose 24.22 percent year over year to $590,000, new listings fell 13.05 percent to 1,019, and homes sold in a median of 28 days at 98.4 percent of list price (FMLS, July 2026). Together, these figures describe a market with tighter inventory and resilient pricing.
If you are considering a move in Atlanta, connect with a local agent at The Agency Atlanta for a personalized market analysis and a look at current listings that fit your goals.